
Read more of the
The GET F.R.E.E. Report
July 23rd, 2026 - The Get F.R.E.E. Close Report

Thursday
July 23rd, 2026
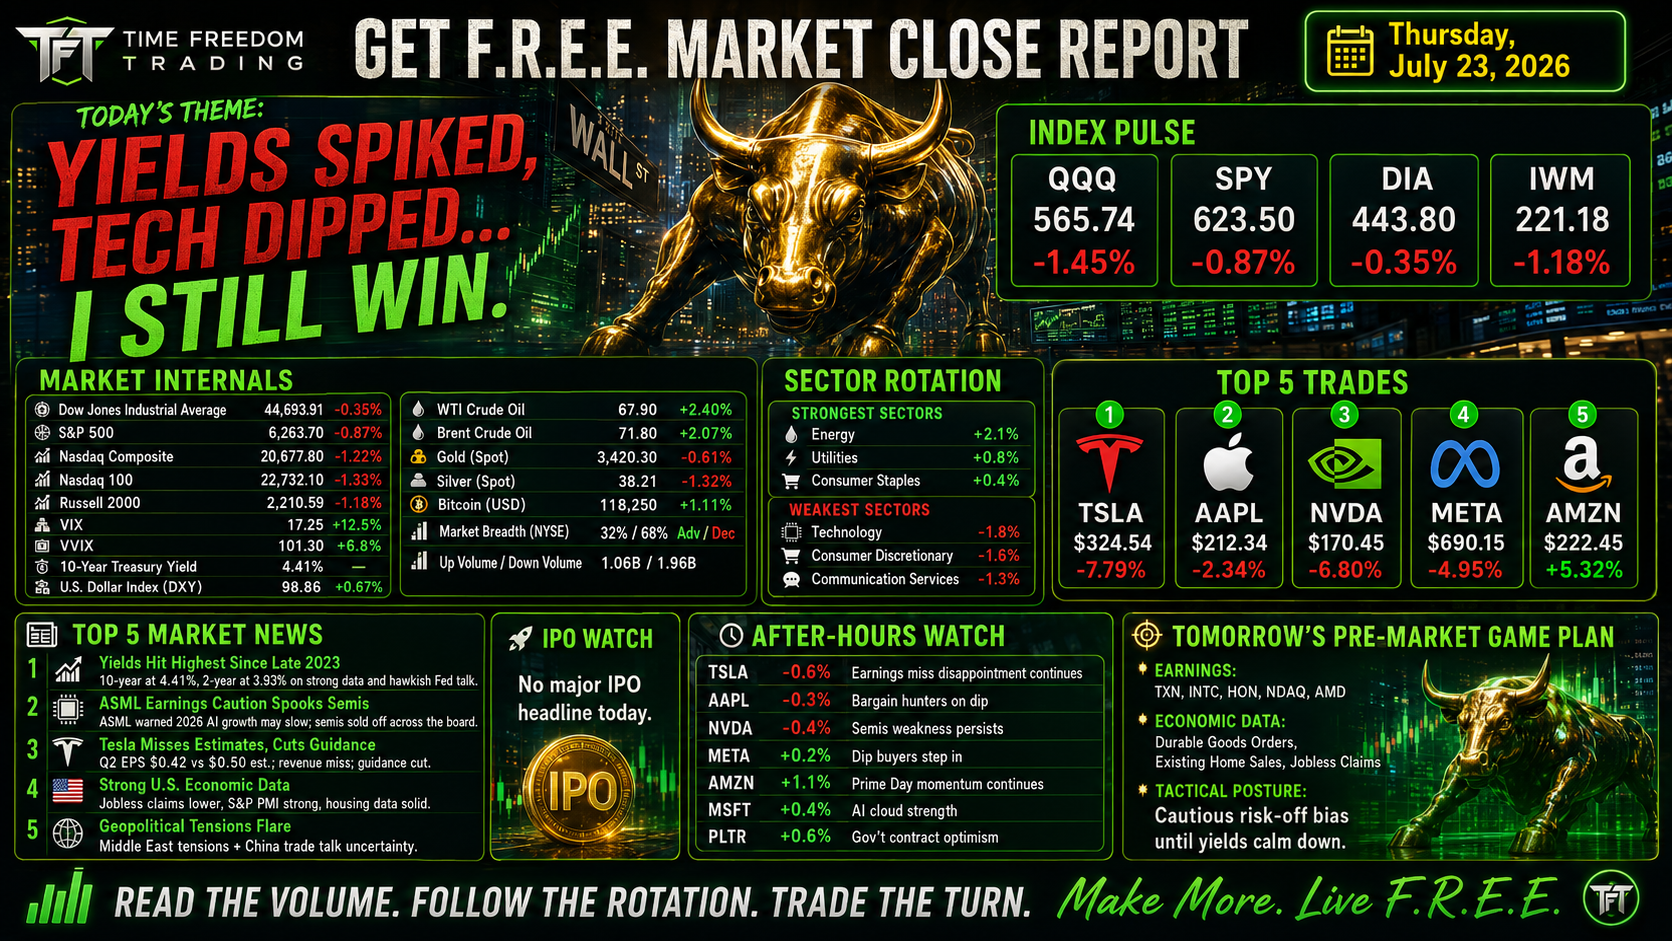
Big Tech Burned Cash.
Oil Brought the Gasoline.
Wall Street got mugged by two expensive realities: AI spending and $100 oil. The Nasdaq dropped 2.15%, the S&P 500 lost 1.24%, and the Dow fell about 1% as Alphabet and Tesla disappointed investors after earnings. Alphabet’s cloud growth was strong, but its sharply higher capital-spending plan triggered a valuation revolt. Tesla delivered negative free cash flow as AI, robotics and manufacturing investments consumed cash faster than a teenager with a borrowed credit card.
Then crude oil kicked the market while it was down. Brent traded above $100 per barrel, WTI jumped more than 6%, and the 10-year Treasury yield climbed near 4.70% as Middle East supply risk reignited inflation fears. Money dumped high-duration technology, hid in defense and selected industrial names, and selectively defended memory-chip exposure.
TFT Read: The market did not reject AI. It rejected AI spending without immediate cash-flow proof. Today, capital rotated away from “trust the vision” and toward “show me the money.”
EARNINGS SEASON:
WHERE HOPE GETS LIQUIDATED
Earnings season does not create volatility. It weaponizes it.
Follow the wrong stock, and your “summer trade” can turn into a very expensive vacation story. The edge comes from seeing the market in 3D: the index, the sector, and the stock all moving together.
That is how you separate real opportunity from an earnings grenade wearing a ticker symbol. Holding blindly through earnings is not trading. It is roulette with better graphics.
Professionals trade the pre-earnings IV rush, the reaction, and the post-earnings IV crush.
Amateurs buy premium, pray to the candle gods, and act surprised when the market repossesses their confidence.
Trade the setup. Respect the catalyst. Know the volatility.
Because if your earnings strategy is built on hope, how many more expensive lessons can your account afford?
Today's Earning Season Action:
The Nasdaq suffered its worst day in roughly a month. Alphabet and Tesla drove the technology selloff, while surging oil and Treasury yields broadened the risk-off move.
TFT Read: This was not hidden weakness. It was weakness wearing a name tag. Higher oil, higher yields, negative breadth and expanding volatility created a hostile environment for expensive growth. The market was not rewarding promises. It was auditing them.
INDEX PULSE
| ETF | Close Price | Daily Change |
|---|---|---|
| QQQ | 691.96 | -1.88% |
| SPY | 738.18 | -1.20% |
| DIA | 516.26 | -1.01% |
| IWM | 292.09 | -0.61% |
Market Internals
| Market Internal | Close / Value | Change / Tone |
|---|---|---|
| Dow Jones Industrial Average | 51,711.65 | -0.97% |
| S&P 500 | 7,408.30 | -1.21% |
| Nasdaq Composite | 25,137.69 | -2.15% |
| Russell 2000 | 2,940.16 | -0.66% |
| Nasdaq 100 / QQQ | 691.96 | -1.88% |
| VIX | Monthly high | volatility expanded |
| VVIX | Not reliably confirmed | unavailable |
| 10-Year Treasury Yield | ~4.70% | higher |
| U.S. Dollar Index | Firmer | inflation/rate support |
| WTI Crude Oil | ~$92.19 | +6.2% |
| Brent Crude Oil | Above $100 | highest since May |
| Gold / GLD | 371.52 | -2.00% |
| Silver / SLV | 52.06 | -3.45% |
| Bitcoin | 65,101 | -1.19% |
| Market Breadth | Broadly negative | technology led declines |
| Up Volume vs. Down Volume | Down-volume dominant | institutional de-risking |
| Strongest Pockets | Defense, selected industrials, memory | |
| Weakest Groups | Mega-cap tech, autos, communication services |
MARKET HEAT MAP - LIVE

TOP 5 MARKET NEWS ITEMS
1. HIGHER YIELDS HIT GROWTH
The Market’s Most Expensive Gravity Problem
WHAT?
Treasury yields surged as stronger labor data and soaring oil prices revived inflation fears. The 10-year Treasury yield traded as high as roughly 4.71% and finished near 4.70%, its highest territory since early 2025.
The pressure came from two directions:
- Initial unemployment claims plunged to 187,000, the lowest level since 1969.
- WTI crude jumped approximately 6.2% to $92.19, while Brent climbed above $100 per barrel.
That combination told the bond market: the economy is not rolling over, energy inflation is accelerating, and the Federal Reserve may have less room to ease policy.
SO WHAT?
Higher yields raise the discount rate applied to future corporate earnings. That is Wall Street language for:
The more expensive money becomes, the less investors are willing to pay today for profits promised five years from now.
That is especially painful for:
- High-multiple technology stocks
- Unprofitable software companies
- AI names priced for flawless execution
- Companies funding growth through debt
- Long-duration speculative assets
The Nasdaq absorbed the hardest hit because growth stocks were already carrying premium valuations. When yields rise while oil climbs, the market starts pricing a nasty cocktail: higher inflation, tighter policy, and lower valuation multiples.
NOW WHAT?
Watch the 4.70%–4.71% zone on the 10-year yield.
A sustained move above that area could continue pressuring QQQ, software, semiconductors, and other long-duration trades. A retreat below approximately 4.65% would remove some valuation pressure, but only if oil also cools.
TFT TAKEAWAY
The market did not suddenly forget that technology is important.
It simply remembered that valuation still matters.
When the risk-free rate rises, expensive stocks must produce proof—not PowerPoint slides, podcasts, and promises wrapped in artificial intelligence.
2. AI-SPENDING ANXIETY SPOOKS SEMIS
The Chips Were Fine. The Price Tag Was Wearing a Ski Mask.
WHAT?
Semiconductor and AI-related stocks weakened as investors questioned the enormous spending required to build the next generation of artificial-intelligence infrastructure.
The immediate pressure was less about a new ASML warning and more about the market connecting several uncomfortable dots:
- Alphabet dramatically increased its projected capital spending.
- Tesla reported heavy investment in robotics, autonomy, and internal chip development.
- Both companies generated concerns about declining or negative free cash flow.
- Rising yields made future AI profits less valuable in present-day terms.
ASML had actually raised its 2026 outlook earlier in July because of strong AI-chip demand. Therefore, the more accurate catalyst was an AI return-on-investment audit, not a fresh ASML warning.
SO WHAT?
The AI trade is entering a more mature phase.
During the first phase, investors rewarded anything that could spell “GPU.” Now the market wants answers:
- How much capital must be spent?
- When does that spending create revenue?
- How much free cash flow survives?
- Who earns the best return—the chip buyer or the picks-and-shovels seller?
- Is demand accelerating, or are companies building capacity faster than customers can monetize it?
This is a critical rotation signal. The market may continue rewarding semiconductor companies with visible orders and pricing power while punishing companies whose AI strategy consumes cash faster than it creates earnings.
NOW WHAT?
Watch whether leading semiconductors can hold their recent breakout levels while QQQ remains under pressure.
The important distinction is:
- Demand weakness would damage the entire AI supply chain.
- Valuation compression can create selective opportunities in companies whose fundamentals remain intact.
- Capex skepticism may favor infrastructure sellers over companies writing the checks.
Look for relative strength in NVDA, AMD, MU, TSM, AVGO, and semiconductor-equipment names. If they stop falling while mega-cap AI spenders remain weak, rotation—not wholesale AI abandonment—may be underway.
TFT TAKEAWAY
AI did not die today.
It received an invoice.
Professionals separate the companies selling the picks and shovels from the companies digging a trillion-dollar hole and calling it innovation,
3. TESLA MISSES—CAPEX GETS A SPEEDING TICKET
Robotaxis, Robots and a Billion-Dollar Cash Bonfire
WHAT?
Tesla shares plunged after second-quarter earnings disappointed investors.
The company reported approximately:
- $28.2 billion in revenue
- $0.33 in earnings per share, below expectations near $0.50–$0.55
- Gross margin of roughly 16.9%
- More than $1 billion in negative free cash flow
- Capital spending that more than doubled to nearly $6 billion
- Expected 2026 capital spending above $25 billion
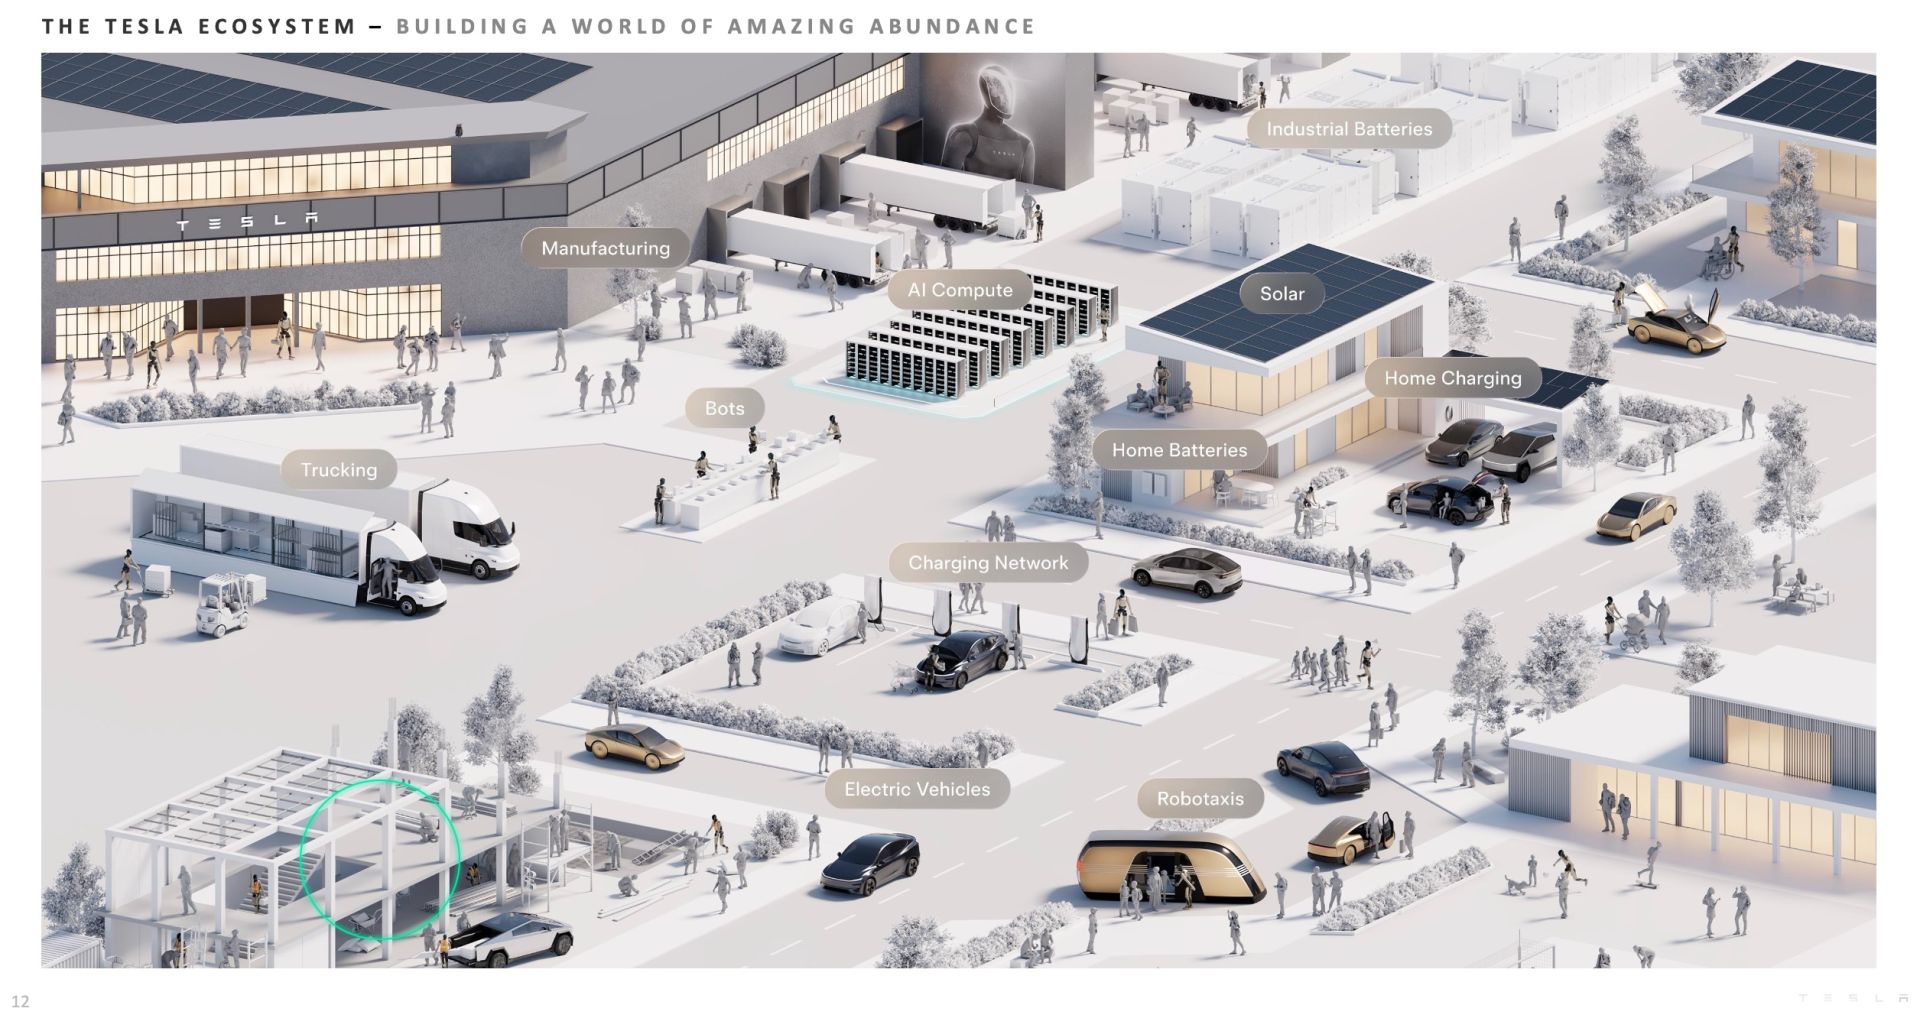
Management continues investing aggressively in autonomous vehicles, robotaxis, Optimus, artificial intelligence, and chip manufacturing. The future may be wearing a robot suit—but the current quarter arrived holding a cash-flow fire extinguisher.
SO WHAT?
Tesla’s valuation depends heavily on businesses that extend well beyond vehicle manufacturing.
That creates a difficult market equation:
The more Tesla spends to prove the future, the more investors must discount the present.
Revenue growth was not enough because the quality of earnings deteriorated. Lower margins, massive capital requirements, and negative free cash flow forced traders to reconsider how much they should pay for autonomy and robotics before those businesses produce reliable profits.
The stock’s decline was also a warning for the broader speculative market. When a high-attention leader misses expectations and loses technical support, traders often reduce exposure across EVs, autonomous-driving names, and high-beta technology.
NOW WHAT?
Watch the earnings gap and the post-earnings low.
A credible stabilization would require:
- Selling volume to contract
- The stock to reclaim intraday VWAP
- The post-earnings low to hold
- Buyers to defend the gap-down zone
- Management commentary to improve confidence in free-cash-flow timing
If Tesla continues making lower highs below the earnings gap, the move remains a downside continuation setup rather than an automatic bargain.
TFT TAKEAWAY
Tesla’s story may still be enormous.
So is the spending bill.
Never confuse a compelling vision with a favorable trade location. A great company story can still produce a terrible chart
4. U.S. ECONOMIC DATA STAYS FIRM
The Economy Refused to Collapse—So Bonds Threw a Tantrum
WHAT?
Initial jobless claims fell sharply to 187,000 for the week ended July 18, down from 209,000 and well below expectations near 211,000–215,000.
That was the lowest claims reading since September 1969.
The report suggested that layoffs remain limited despite slower hiring, corporate cost reductions, trade uncertainty, elevated energy prices, and restrictive interest rates.
SO WHAT?
Good economic news became difficult market news.
A resilient labor market reduces the immediate probability of recession, but it also gives the Federal Reserve less urgency to cut rates. Combined with surging oil, the data reinforced the idea that inflation could remain sticky—or accelerate again.
That created a split tape:
- Cyclicals and select industrial names showed relative strength.
- High-duration growth stocks weakened.
- Small caps held up better than mega-cap technology in parts of the session.
- Rate-sensitive sectors faced pressure.
- The dollar strengthened while gold weakened.
The economy was not the problem. The market’s prior expectation for easier financial conditions was.
NOW WHAT?
Watch whether future labor and inflation data confirm the same message.
The market now needs one of two things:
- Economic strength without renewed inflation, or
- Softer growth that allows yields to retreat without triggering recession fears.
Anything in between leaves the market trapped in the “too strong for cuts, too expensive for growth stocks” zone.
TFT TAKEAWAY
Markets do not trade data in isolation.
They trade the difference between the data and what was already priced in.
The economy beat expectations. Growth stocks still got punched. Welcome to the market—where good news occasionally arrives carrying brass knuckles.
5. GEOPOLITICAL TENSIONS FLARE
Oil Put on a Cape. Tech Got the Hospital Bill.
WHAT?
Middle East tensions intensified after attacks on Saudi oil tankers and renewed threats involving Iran and critical shipping routes.
The disruption raised concerns about traffic through the Strait of Hormuz and Bab el-Mandeb—two major arteries for global energy supplies.
The result:
- WTI crude climbed to approximately $92.19
- Brent crude settled near $100.69
- Energy stocks gained relative strength
- Defense names attracted attention
- Airlines, transportation stocks, and other fuel-sensitive industries faced pressure
- Inflation expectations and Treasury yields moved higher
The geopolitical catalyst mattered because it attacked the market through the commodity channel, not merely through headline fear.
SO WHAT?
Oil above $100 changes the market conversation.
Higher energy prices can:
- Raise transportation and manufacturing costs
- Pressure consumer spending
- Squeeze corporate margins
- Delay central-bank easing
- Increase inflation expectations
- Benefit energy producers and defense contractors
- Hurt airlines, retailers, logistics companies, and discretionary spending
That means geopolitics became a sector-rotation event.
Money did not simply leave the market. Some of it moved toward energy, defense, railroads, and inflation beneficiaries while exiting expensive technology and fuel-sensitive businesses.
NOW WHAT?
Watch three things:
- Whether Brent remains above $100
- Whether shipping disruptions widen
- Whether diplomatic language escalates or de-escalates
If oil holds above the breakout, energy may retain leadership and yields may remain elevated. If geopolitical tensions cool and crude rapidly loses $100, some of Thursday’s inflation trade could unwind.
TFT TAKEAWAY
Geopolitical headlines are not trade setups by themselves.
Price, volume, and sector confirmation turn headlines into setups.
Do not chase the first missile-shaped candle. Follow the rotation, identify the liquid leaders, and wait for the chart to confirm that institutions—not social-media panic—are driving the move.
THE CONNECTED MARKET STORY
Thursday was not five unrelated headlines.
It was one chain reaction:
Geopolitical tension pushed oil higher.
Higher oil revived inflation fears.
Strong labor data reinforced those fears.
Inflation fears lifted Treasury yields.
Higher yields compressed technology valuations.
Earnings misses and massive AI spending gave investors a reason to sell first and question the robot revolution later.
That is what seeing the market in 3D looks like:
Catalyst → Asset Class → Sector → Stock → Setup
The amateur saw five scary headlines.
The professional saw capital rotate from high-multiple growth toward energy, defense, select industrials, and companies producing current cash flow.
Read the volume. Follow the rotation. Trade the turn.
Make More. Live F.R.E.E.
TOP 5 KEY TRADES of the DAY
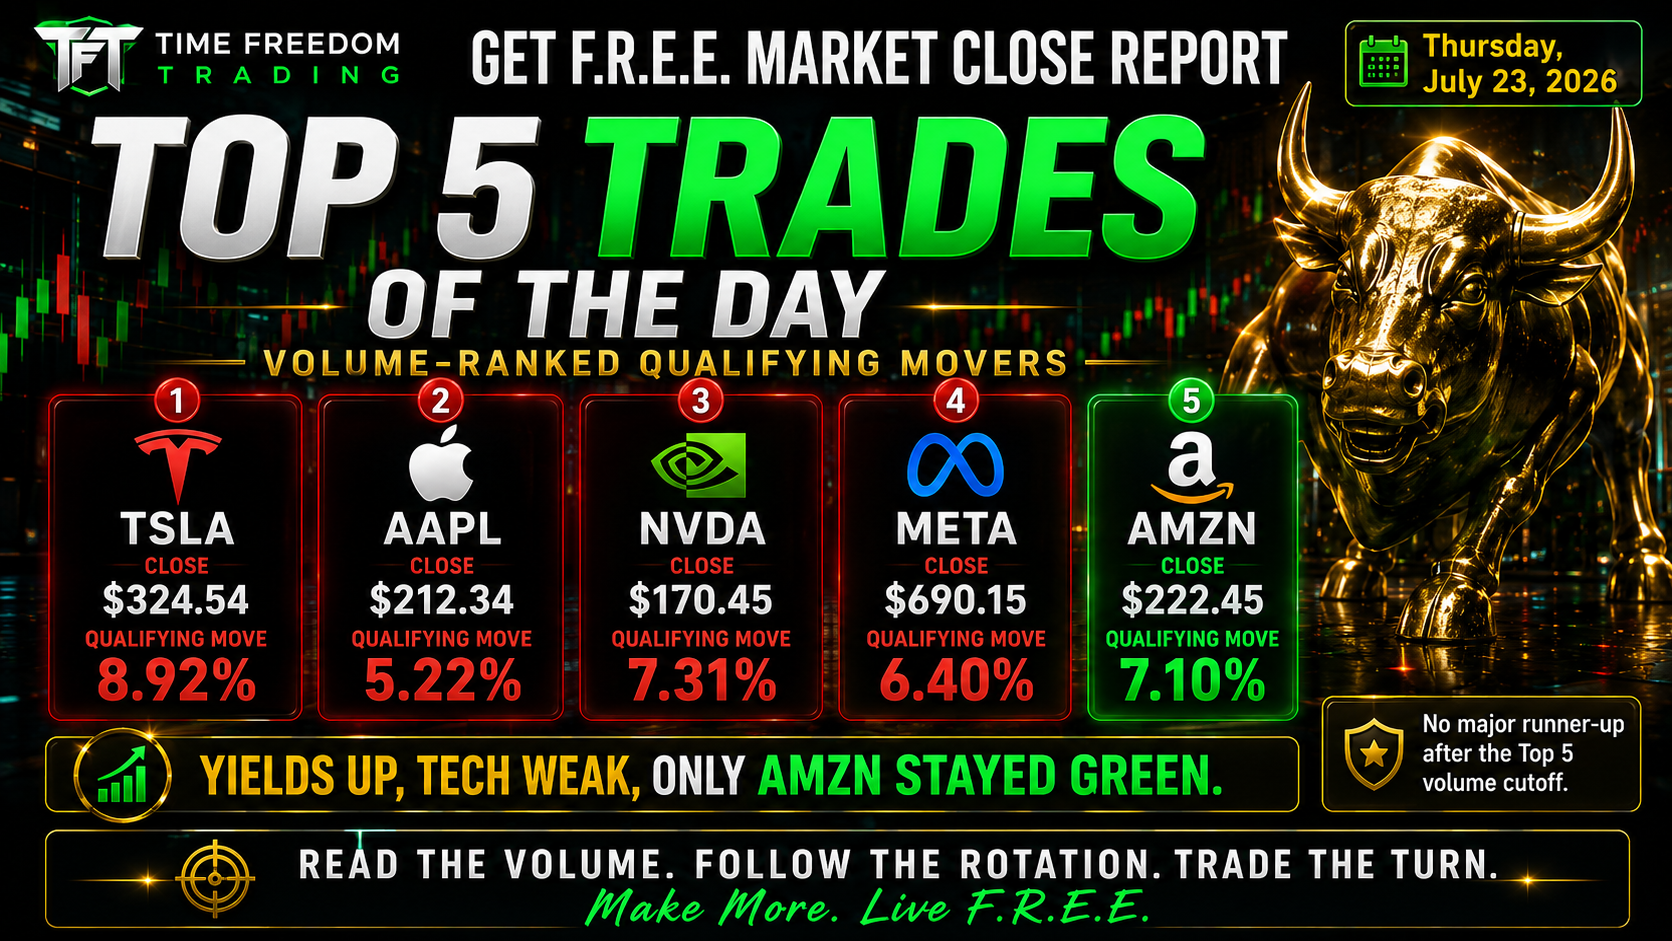
Today’s volume-ranked story was INTC, TSLA, SMCI, GOOGL and MARA. Intel traded through a violent earnings-positioning range before delivering a strong after-hours beat.
Tesla became the market’s cash-burn cautionary tale.
Super Micro held relative strength while the broader tape collapsed.
Alphabet proved that excellent cloud growth can still get punished when capital expenditure frightens the cash-flow police.
MARA gave traders crypto-infrastructure volatility while Bitcoin softened.
The institutional thread was clear: volume followed catalysts, uncertainty and repricing. Chase without a system and the market turns your conviction into a charitable donation.
1. INTC — Intel Corporation
- Close: 100.23
- Daily move: -2.33%
- Open-to-close move: -0.76%
- Intraday range %: 14.27%
- Qualifying move: 14.27%
- Open: 101.00
- High: 113.66
- Low: 99.25
- Intraday range: 14.41
- Volume: 120,490,532
-
Volume rank note: Highest verified qualifying volume.
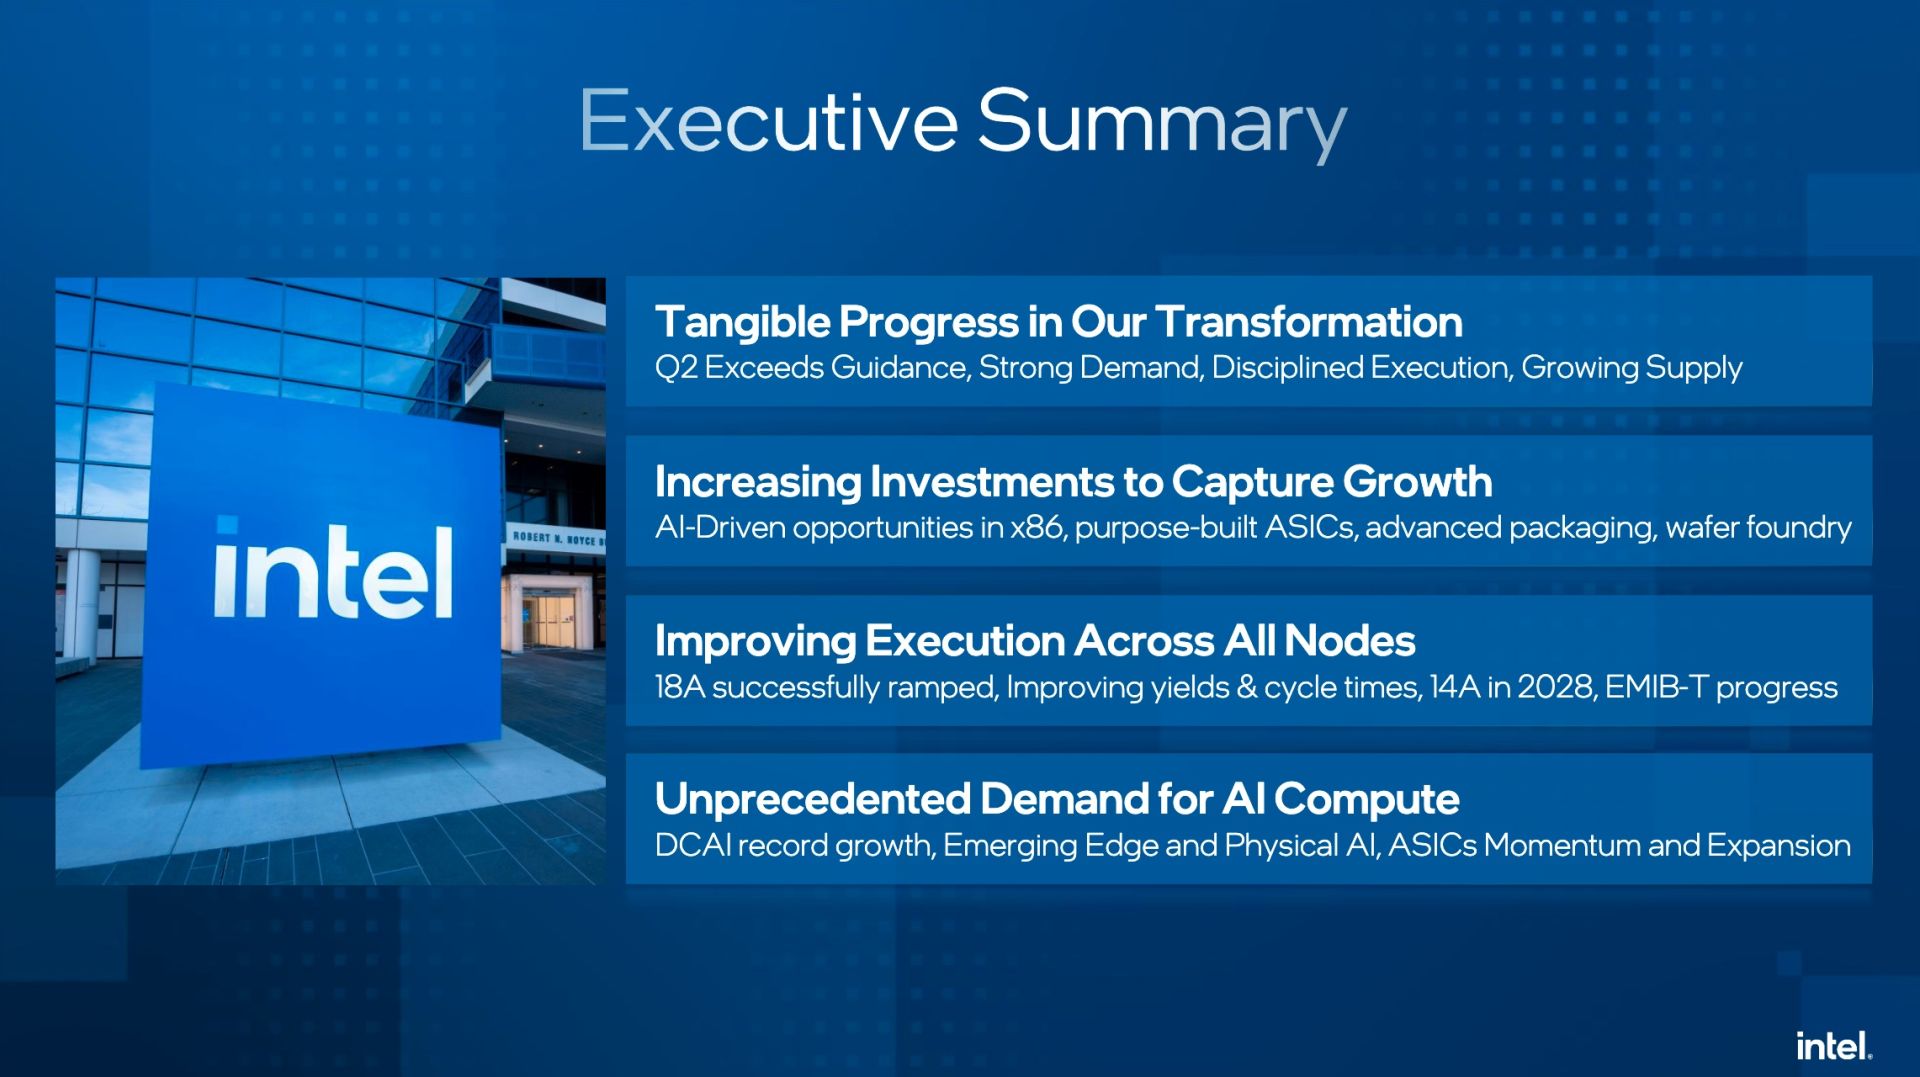
Catalyst: Investors positioned aggressively before Intel’s earnings. After the close, Intel reported stronger-than-expected sales, profit and guidance as agentic-AI demand strengthened server CPU sales. The stock subsequently jumped more than 12% after hours.
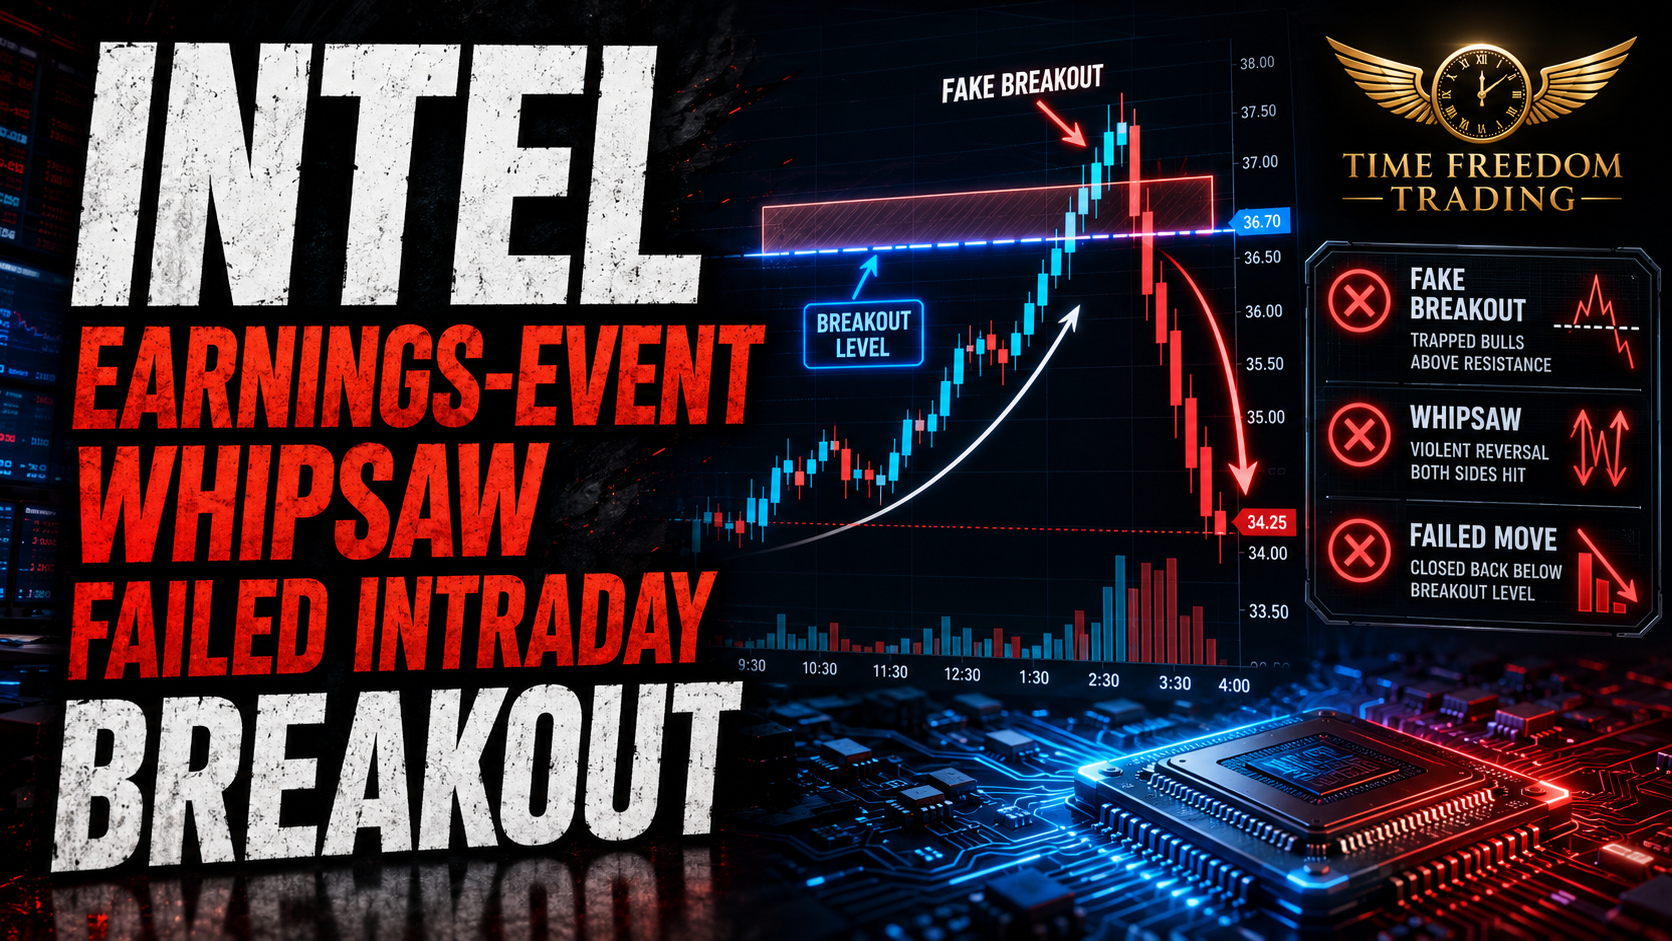
Chart Read: Earnings-event whipsaw and failed intraday breakout.
What?
Intel traded from 99.25 to 113.66, briefly exploded higher, then surrendered the move and closed near 100 before earnings.
So What?
The 14% range showed extreme institutional disagreement. The post-close earnings reaction suggests the daytime weakness did not fully reflect the improving operating story.
Now What?
Watch 113.66 as the regular-session breakout reference, 101–100 as the pivot and 99.25 as failure support. Friday’s opening gap must hold to confirm the after-hours move.
Daily Chart Pattern + Follow-Through Read
- Pattern: pre-earnings whipsaw
- Key level: 113.66
- Follow-through: hold the earnings gap and reclaim the session high
- Failure: fade below 101
- Risk note: after-hours gains can shrink materially before the open
TFT Read: Intel spent the regular session acting confused, then read the earnings script after hours and remembered the plot.
2. TSLA — Tesla
- Close: 319.69
- Daily move: -14.56%
- Open-to-close move: -6.25%
- Intraday range %: 12.15%
- Qualifying move: 14.56%
- Open: 341.00
- High: 357.24
- Low: 315.82
- Intraday range: 41.42
- Volume: 114,711,619
-
Volume rank note: Second-highest qualifying volume.
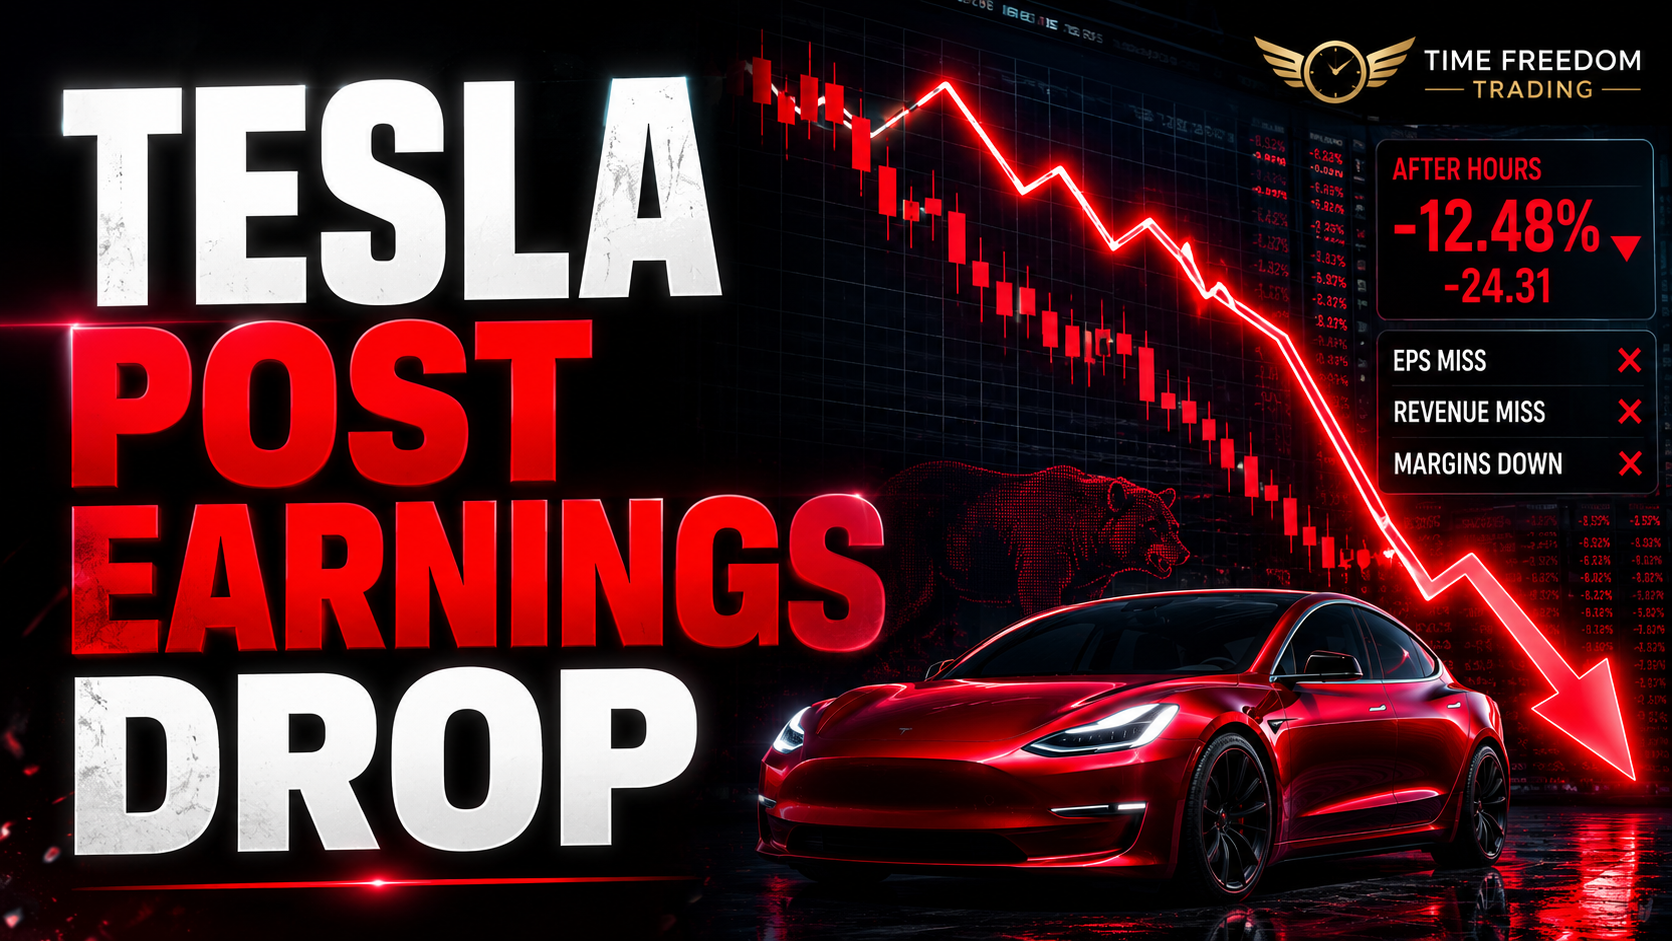
Catalyst: Tesla missed profit expectations and reported more than $1 billion of negative free cash flow as AI, robotics and manufacturing investments surged. Investors also focused on falling revenue, weaker pricing and reduced EV tax-credit support.
Chart Read: Earnings gap-down and downside continuation.
What?
Tesla fell nearly 15%, traded more than 114 million shares and closed close to its session low.
So What?
The market stopped paying for distant robotaxi promises and started charging interest on current cash burn.
Now What?
Watch 315.82 as immediate support. A reclaim of 341 would begin repairing the breakdown; 357.24 is the stronger recovery hurdle.
Daily Chart Pattern + Follow-Through Read
- Pattern: earnings breakdown
- Key level: 315.82
- Follow-through: stabilize and reclaim 341
- Failure: sustained break below 315.82
-
Risk note: high-volume earnings gaps can produce sharp reflex bounces
TFT Read: Tesla did not merely miss earnings. It sent free cash flow to witness protection.

3. SMCI — Super Micro Computer
- Close: 31.20
- Daily move: +2.16%
- Open-to-close move: +2.83%
- Intraday range %: 8.31%
- Qualifying move: 8.31%
- Open: 30.34
- High: 32.58
- Low: 30.06
- Intraday range: 2.52
- Volume: 84,188,823
- Volume rank note: Third-highest qualifying volume.
Catalyst: Super Micro retained relative strength after reporting stronger profitability and a large AI-server order backlog earlier in the week.
Chart Read: Relative-strength range expansion inside a weak technology tape.
What?
SMCI traded through an 8.3% range and finished higher while the Nasdaq collapsed.
So What?
Relative strength during a broad selloff signals focused sponsorship. Institutions did not abandon every AI-infrastructure name.
Now What?
Watch 32.58 as continuation resistance and 30.06 as the failure line.
Daily Chart Pattern + Follow-Through Read
- Pattern: relative-strength consolidation
- Key level: 32.58
- Follow-through: close above 32.58 with volume
- Failure: lose 30.06
- Risk note: AI-server names remain headline-sensitive
TFT Read: While Big Tech burned cash, Super Micro quietly sold the ovens.
4. GOOGL — Alphabet
- Close: 317.69
- Daily move: -7.17%
- Open-to-close move: -1.20%
- Intraday range %: 5.10%
- Qualifying move: 7.17%
- Open: 321.56
- High: 331.53
- Low: 315.14
- Intraday range: 16.39
- Volume: 68,927,699
-
Volume rank note: Fourth-highest qualifying volume.
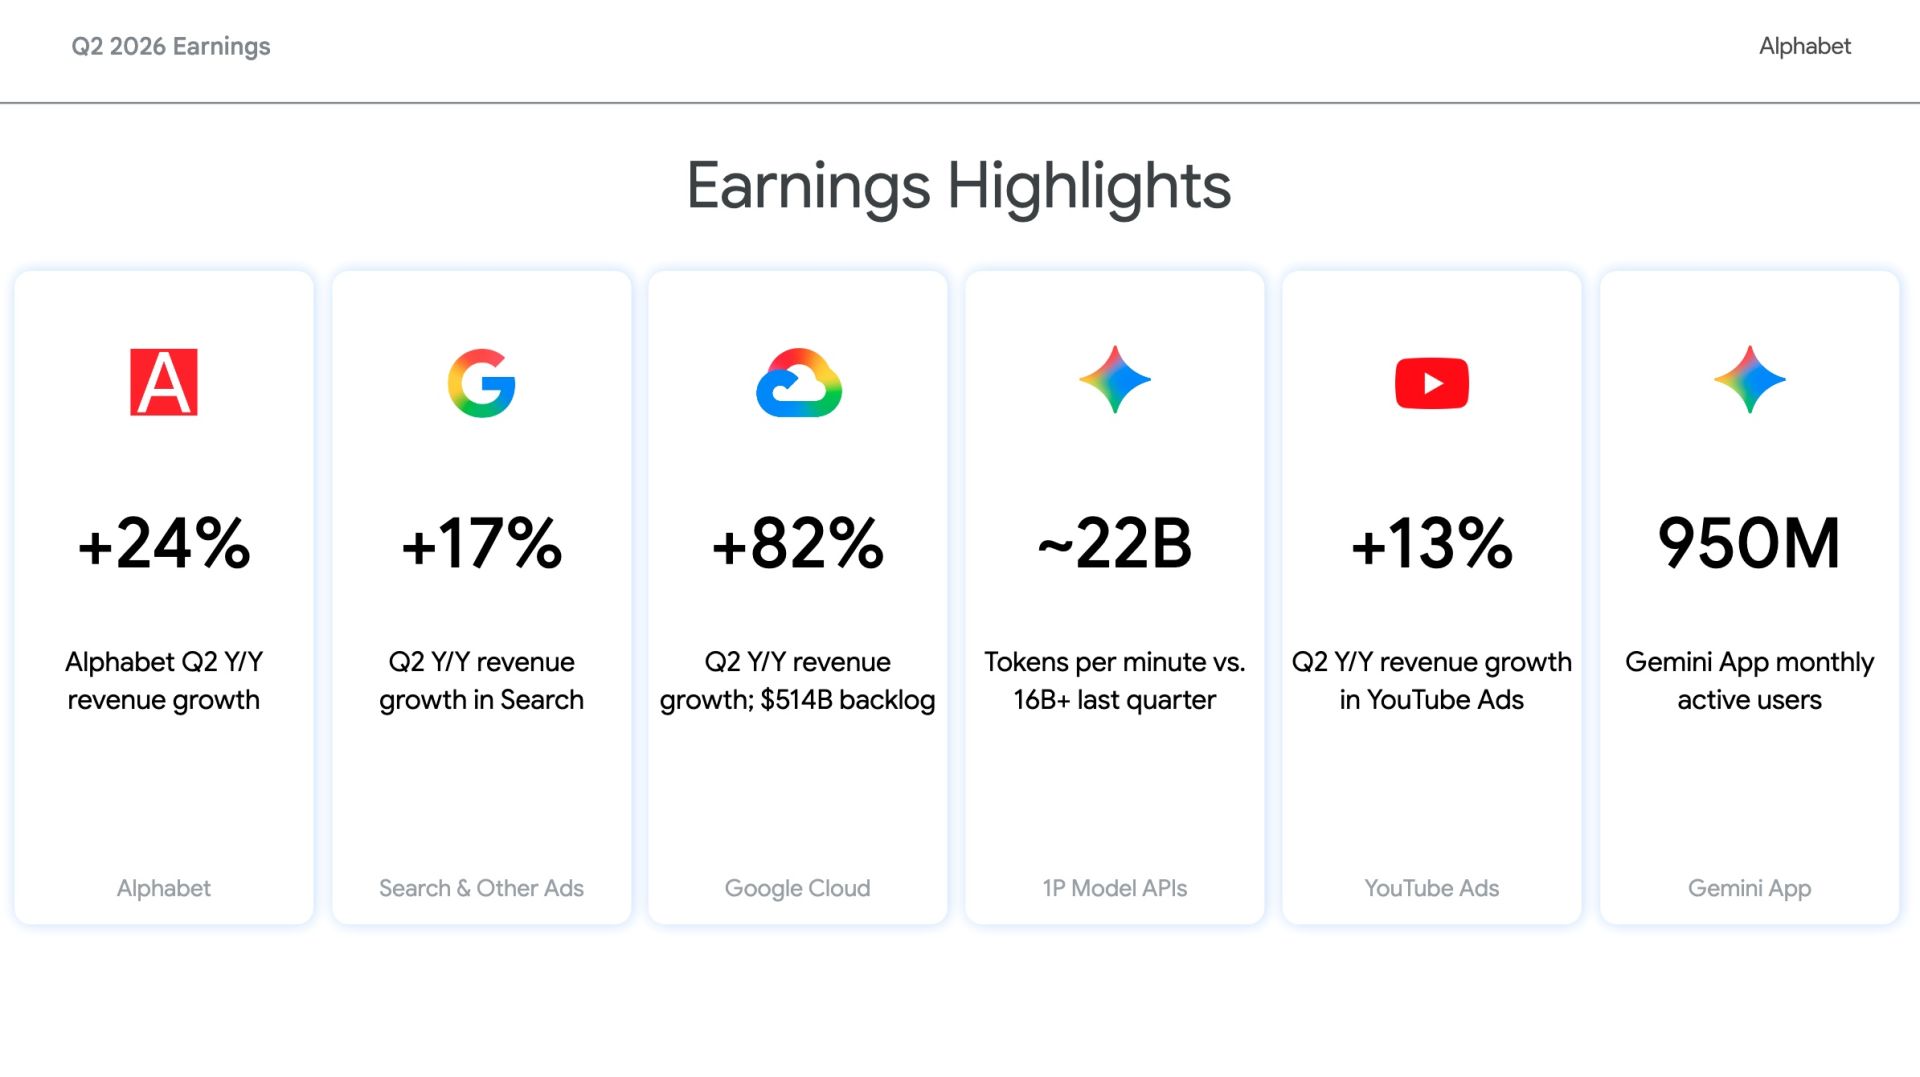
Catalyst: Alphabet beat earnings expectations and delivered powerful cloud growth, but investors punished management’s plan to raise annual capital spending to roughly $195–$205 billion.
Chart Read: Earnings gap-down and failed recovery.
What?
Alphabet dropped more than 7% despite beating reported earnings expectations.
So What?
The market valued cash-flow discipline more than the headline beat. Growth was good. The bill was terrifying.
Now What?
Watch 315.14 as support, 321.56 as the opening pivot and 331.53 as the first meaningful reclaim.
Daily Chart Pattern + Follow-Through Read
- Pattern: capex-driven earnings breakdown
- Key level: 315.14
- Follow-through: reclaim 321.56, then 331.53
- Failure: break below 315.14
-
Risk note: mega-cap gaps can influence the entire index
TFT Read: Alphabet doubled down on AI spending. Shareholders responded by doubling down on the exit button.
5. MARA — MARA Holdings
- Close: 12.77
- Daily move: +2.90%
- Open-to-close move: +5.28%
- Intraday range %: 9.32%
- Qualifying move: 9.32%
- Open: 12.13
- High: 13.15
- Low: 12.02
- Intraday range: 1.13
- Volume: 58,424,908
- Volume rank note: Fifth-highest qualifying volume.
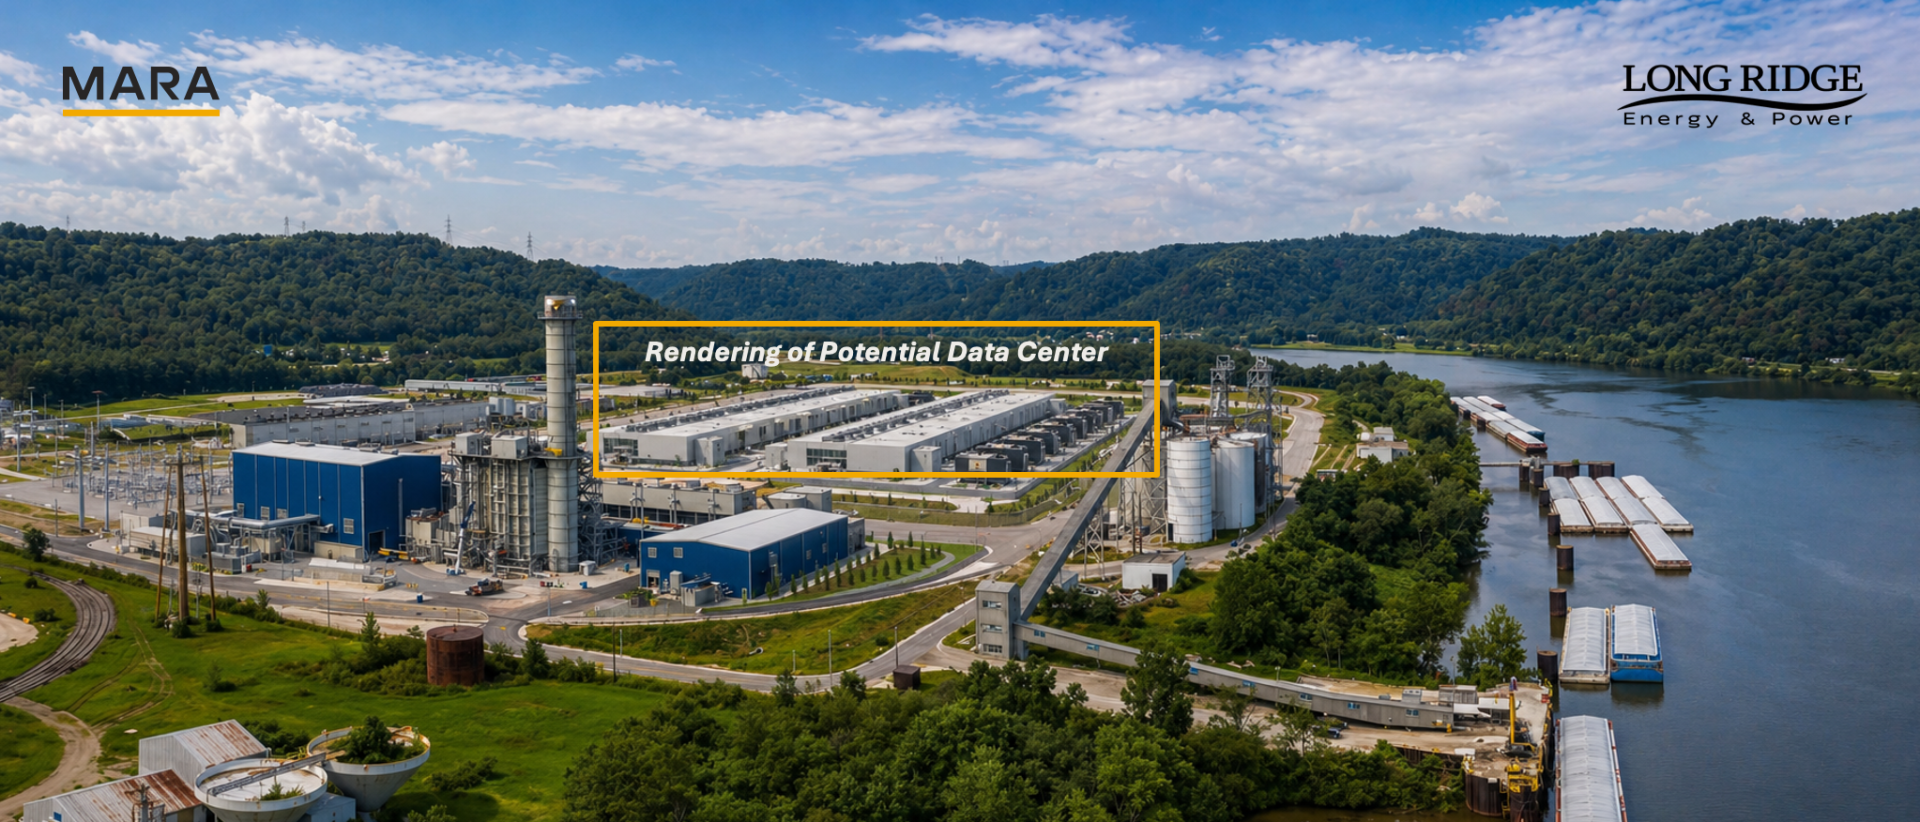
Catalyst: MARA retained speculative interest as investors continued evaluating miners as both Bitcoin proxies and power-rich digital-infrastructure platforms.
Chart Read: High-volume range expansion with relative strength.
What?
MARA traded through a 9.3% range and closed more than 5% above its opening price despite a weak broader market.
So What?
Speculative capital remained active. Risk appetite did not disappear—it narrowed into selected volatility pockets.
Now What?
Watch 13.15 for continuation and 12.02 as the failure level.
Daily Chart Pattern + Follow-Through Read
- Pattern: relative-strength range breakout
- Key level: 13.15
- Follow-through: hold 12.77 and clear 13.15
- Failure: lose 12.02
- Risk note: Bitcoin weakness can reverse miner momentum quickly
TFT Read: MARA was green in a red market. That makes it interesting—not immortal.
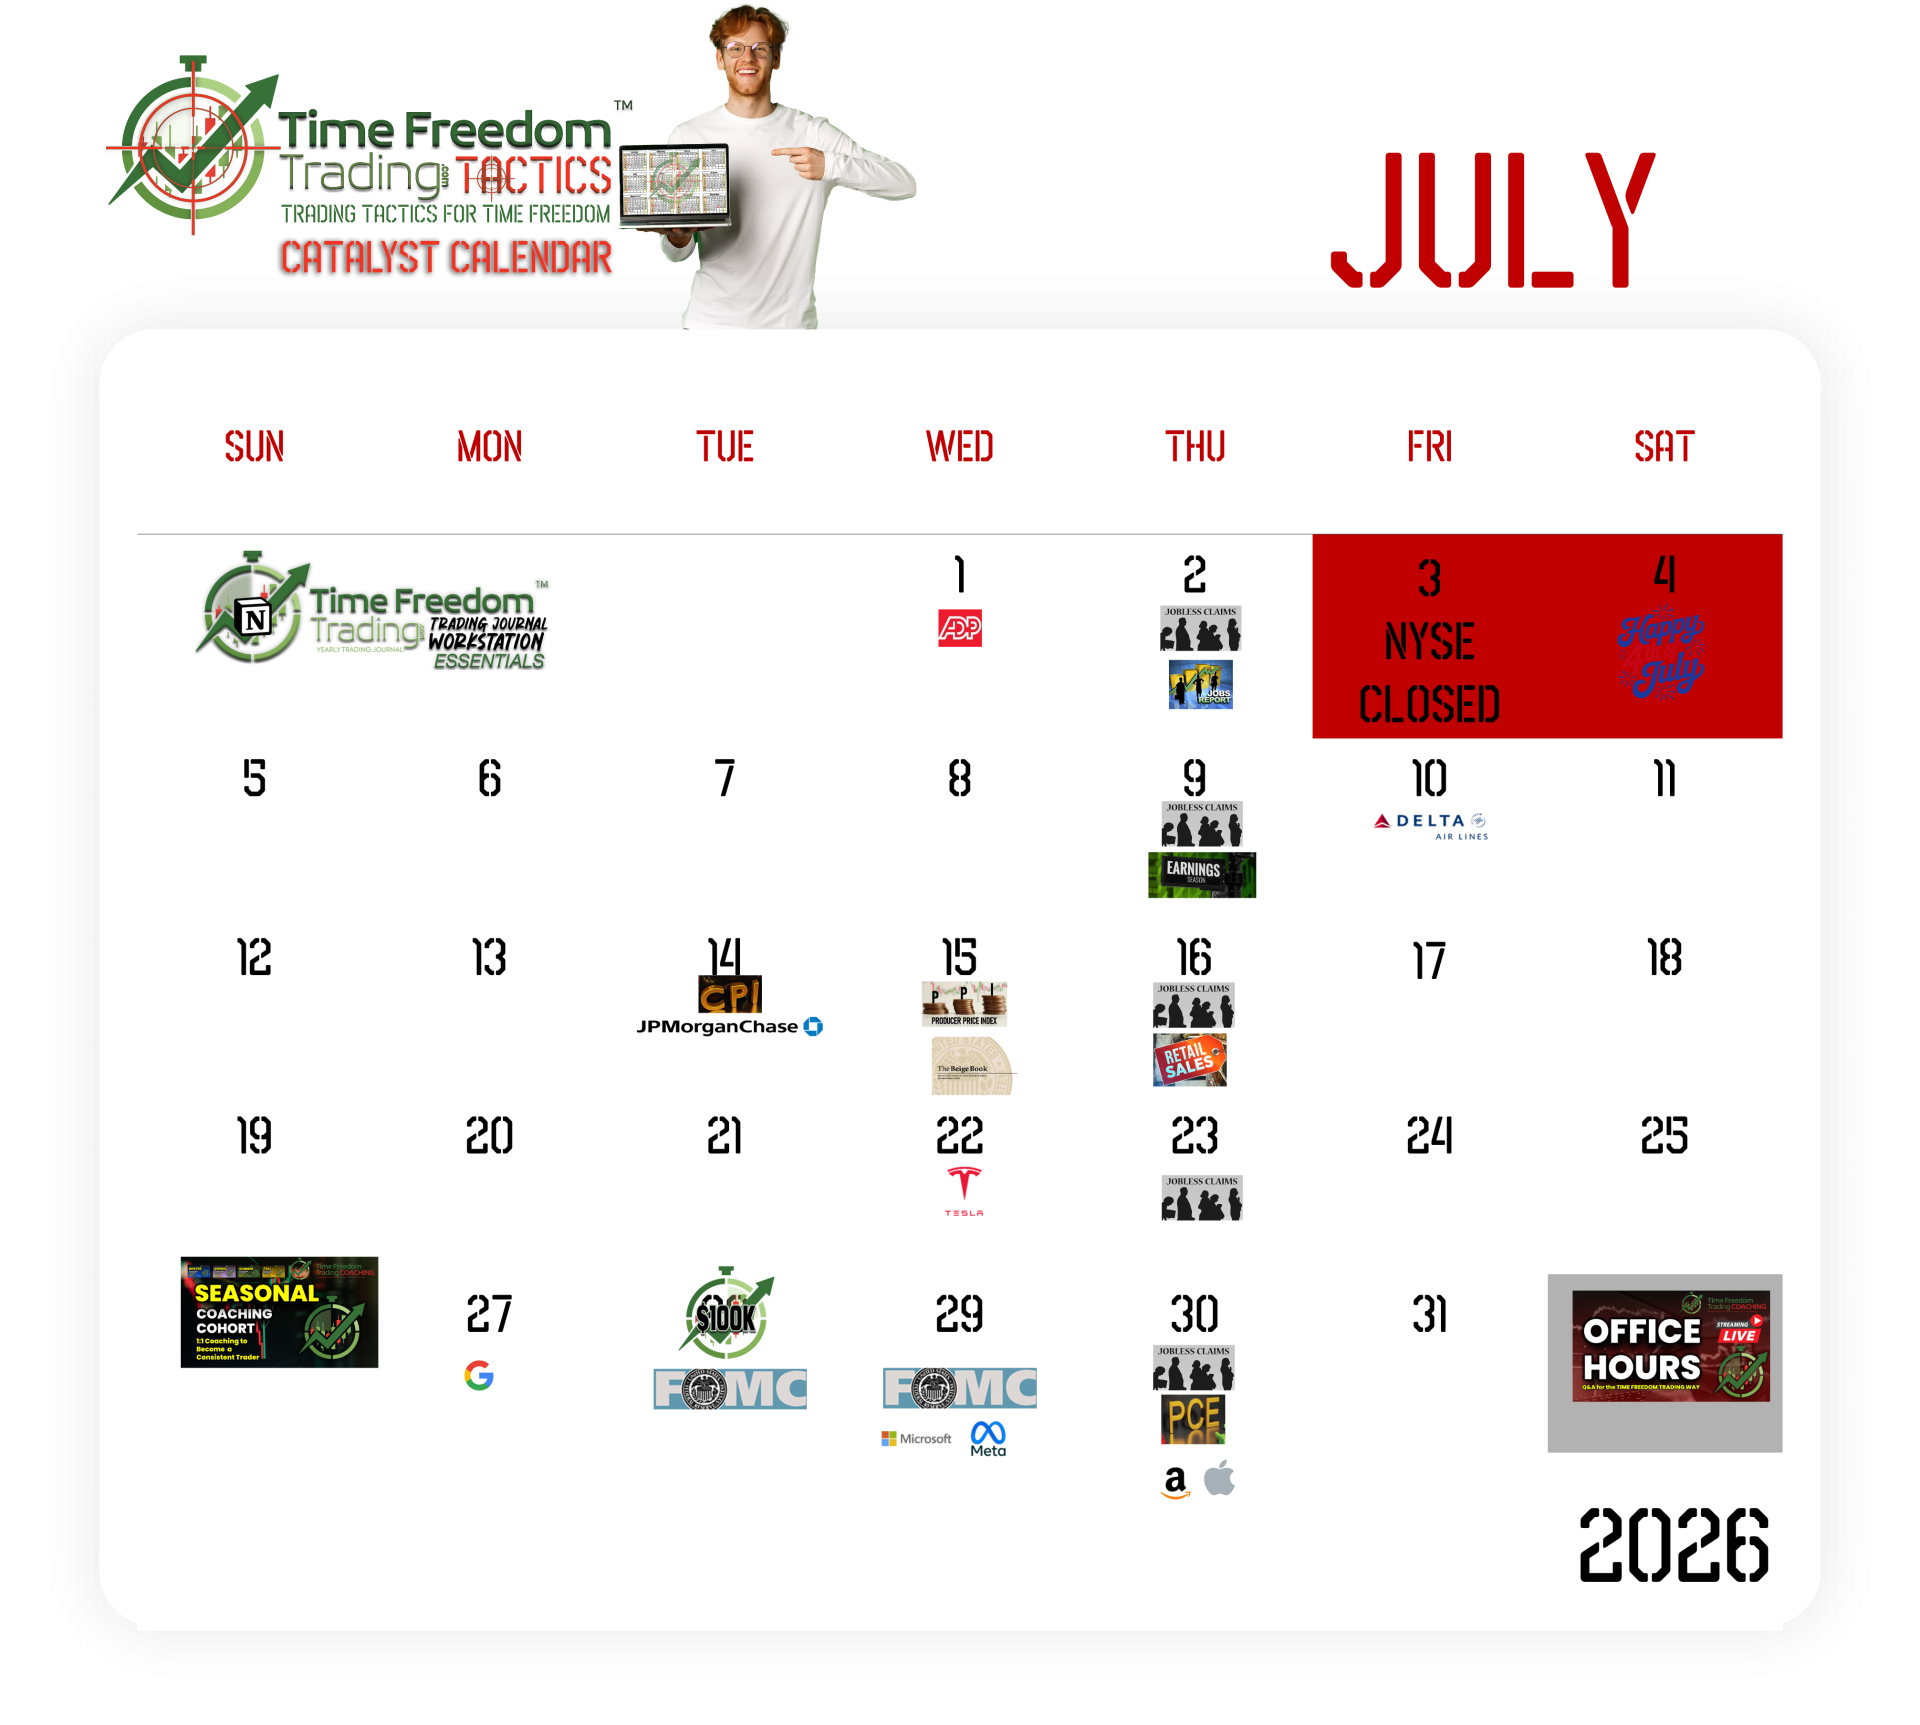
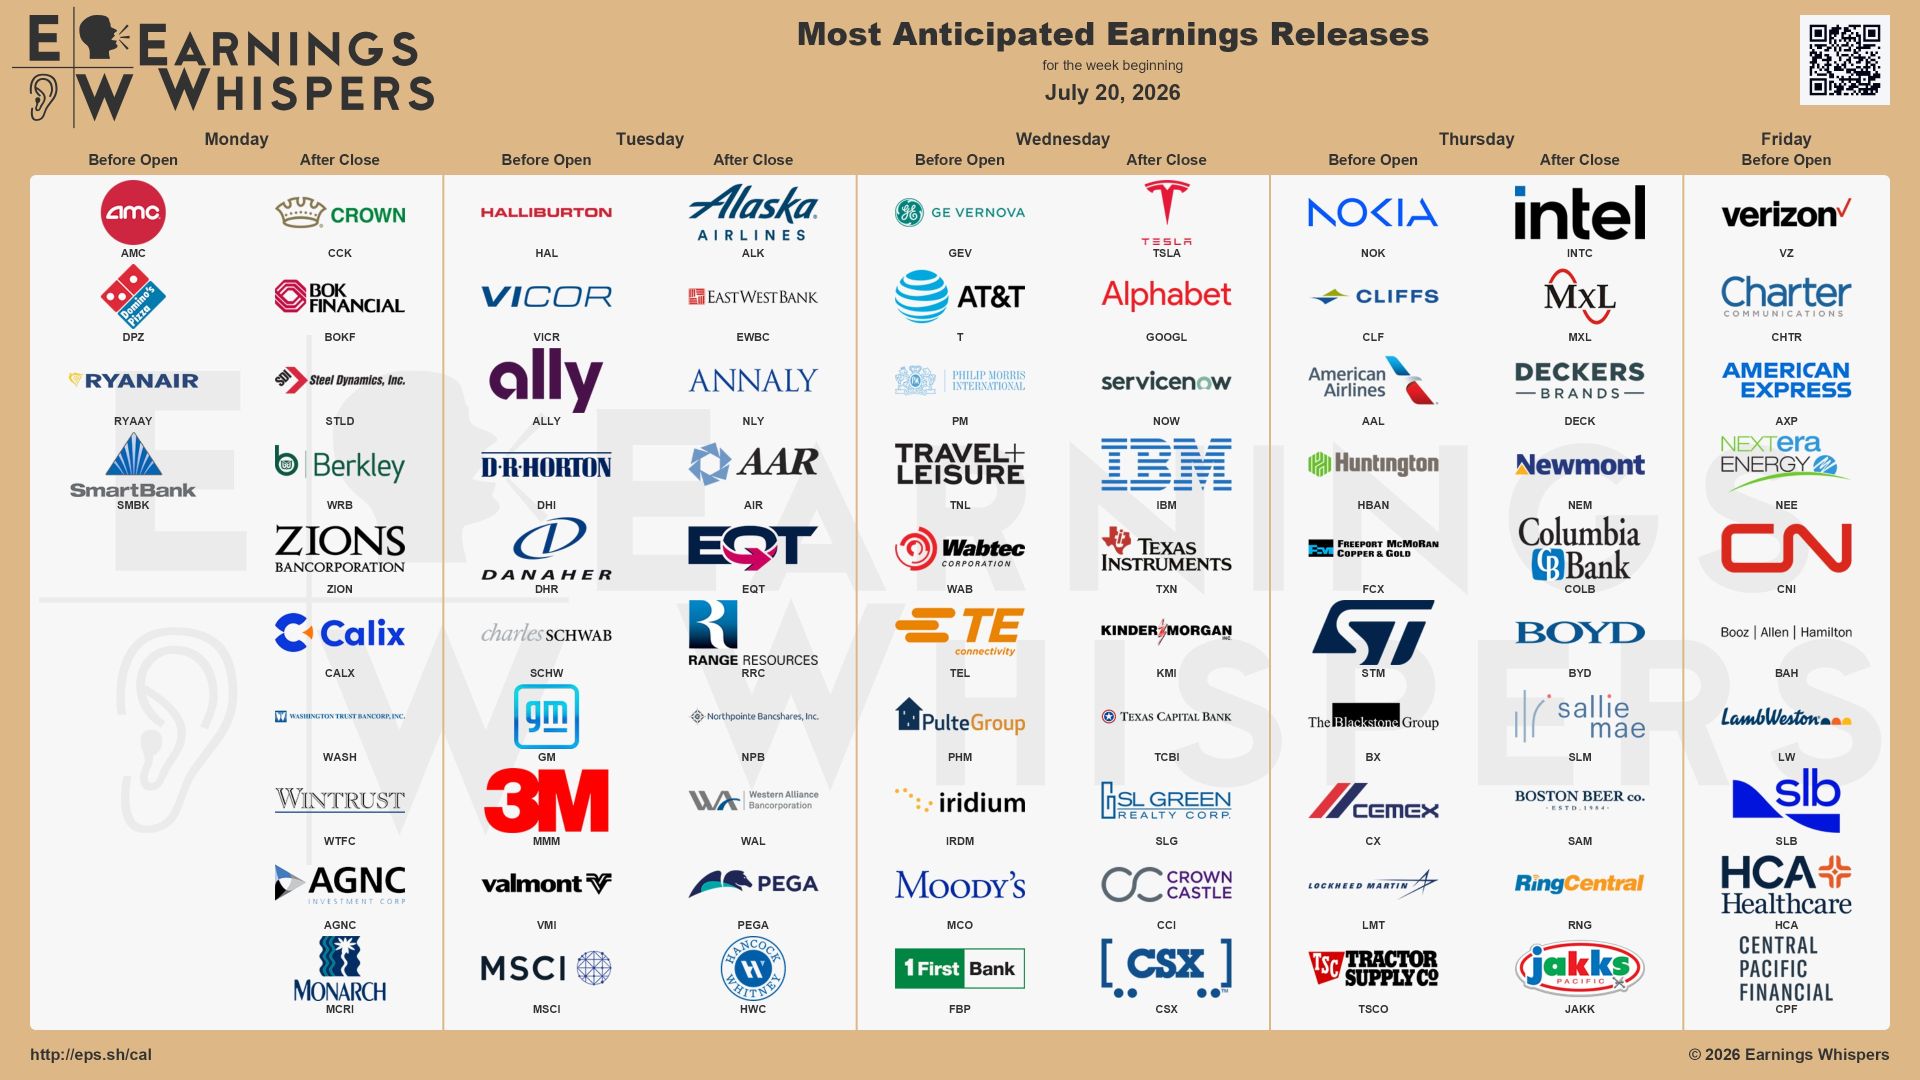
WEEK 30
THIS WEEK'S EARNINGS IN FOCUS
THIS WEEK'S EARNINGS IN FOCUS
AFTER HOURS WATCH
| Ticker | After-Hours Signal | TFT Read |
|---|---|---|
| INTC | More than +12% | Earnings beat and strong AI-server outlook |
| CSX | Approximately +4% | Earnings reaction and operational outlook |
| TMUS | Earnings digestion | Subscriber growth slowed despite revenue/profit growth |
| LMT | Regular-session strength | Defense demand and raised outlook |
| TSLA / GOOGL | Continued active trading | Watch whether earnings gaps stabilize |
Tomorrow’s
Pre-Market
Game Plan
Friday, July 24, 2026
Friday’s main economic reports include the flash U.S. services PMI, flash manufacturing PMI and June new-home sales.
| Area | Key Watch | TFT Tactical Posture |
|---|---|---|
| Intel | Earnings gap and 113.66 reference | breakout/fade watch |
| Flash Services PMI | Inflation and growth mix | yield trigger |
| Flash Manufacturing PMI | Factory momentum | cyclical read |
| New-Home Sales | Housing demand and rates | consumer/rate signal |
| QQQ | 687.87 support / 704.72 resistance | retracement watch |
| SPY | 735.25 support / 746.40 resistance | risk-off recovery test |
| IWM | 290.17 support / 294.10 resistance | breadth check |
| VIX | Monthly-high follow-through | volatility test |
| 10-Year Yield | 4.70% area | growth-pressure trigger |
| Oil | WTI 92 / Brent 100 | inflation and geopolitical risk |
| Leading Tech | INTC, GOOGL, TSLA, NVDA, MU, SMCI | earnings rotation |
| IPO Watch | SCTX / JMKE pipeline | valuation discipline |

“Wisdom preserves those who have it.”
— Ecclesiastes 7:12
Today exposed the difference between growth and profitable growth. Alphabet delivered exceptional cloud expansion, yet investors punished the stock because the cost of pursuing AI rose faster than their comfort with future cash flow. Tesla’s story remained ambitious, but negative free cash flow made the present impossible to ignore. Markets do not reject vision. They simply stop overpaying when the bill arrives.
Tomorrow, Intel’s earnings gap will tempt traders to declare the entire chip correction finished before breakfast. Wisdom requires more. Does the gap hold? Does volume confirm? Do yields and oil calm down? Does QQQ reclaim resistance? Your system protects you from converting a good headline into a bad entry.
Actionable Summary
- Mark QQQ 687.87 support and 704.72 resistance.
- Mark SPY 735.25 support and 746.40 resistance.
- Watch Intel 113.66 as the regular-session breakout reference.
- Watch Tesla 315.82 support and 341 reclaim resistance.
- Watch Alphabet 315.14 support and 331.53 resistance.
- Track Brent near $100 and the 10-year yield near 4.70%.
- Require confirmation before chasing the Intel earnings gap.
- Trade valuation and reaction—not excitement.
When Is Your When?
How many earnings collapses will you watch before cash flow becomes part of your analysis?
How many AI headlines will you chase before valuation becomes part of your operating system?
What will continued inaction cost while your money remains unemployed and your paycheck remains your parole officer?
- Build your Wealth Operating System.
- Learn to read the market in 3D.
- Stop trading time for money.
- Make More. Live F.R.E.E.
“The reason you have a job....
is because your money is unemployed!"
LETS FIX THAT!


“FAST FORWARD to DECEMBER of 2026"
If you want 2026 to be the year you stop reacting and start operating… join Time Freedom Trading.
You’ll learn to:
-
Trade the retracement instead of chasing breakouts late
-
Use the 50MA/200MA like a pro (structure, bias, risk)
-
Build a Wealth Operating System that compounds skill into freedom
Because the clock’s not ticking — it’s compounding.
And the market doesn’t pay hope… it pays execution.
Fast-forward 12 months.
It’s December 2026.
The Fed is doing whatever the Fed does.
AI is on its 7th hype cycle.
But here’s the only question that matters:
Are you still hoping rate cuts save your portfolio…
or are you calmly executing a proven trading operating system that funds your lifestyle, your legacy, and your time freedom?
You just read a full breakdown of:
-
How the macro winds are shifting.
-
Where rotation and reversal trades are setting up.
-
How to weaponize something as simple as an engulfing candle for asymmetric entries.
The next move isn’t more information.
It’s installation.
So ask yourself — honestly:
If you keep living the way you lived in 2025,
will you be any closer to time freedom by next December?
If the answer stings, good. That’s your signal.
Lock in a plan with Time Freedom Trading — the E.D.G.E. system, the $1K Way, the Tactics Newsletter, build a Financial Flywheel — and give your future self a very different December.
Because you’re one trade, one turn, one moment of clarity away from changing your life.
And if this hit you… you already know what you’re supposed to do next.
🎁 Build your Financial Flywheel.
🎁 Learn to trade with clarity, consistency, and conviction.
🎁 Step into the new year: take your time back.
Imagine compounding skill, capital, and confidence for 12 months straight…
Would that change your 2026?
You’re just one trade away.

IS TIME FREEDOM TRADING
TAX DEDUCTIBLE?
If you’re paying for trading education but not structuring it properly…
you might be overpaying twice.
Once to learn.
Again at tax time.
Most traders guess.
The IRS doesn’t reward guessing — it rewards structure.
We broke down exactly when trading education may qualify as a tax deduction, how active traders set it up CPA-clean,
and what documentation actually matters.
👉 Read this before your CPA does:
Trading Education Tax Deduction – CPA-Ready Guide
If you’re already investing in your edge…
why let bad structure erode it?
Want to
"SEE"
the Market
Correctly?
SEE the Market
Like a Time Freedom Trader!
Most people stare at charts the way rookies stare at MRI scans —
lots of squiggles… zero understanding… and a whole lot of “uhhh, is this bad?”
Time Freedom Traders don’t look at the market.
We see it — in 3D, in real time, with clarity sharp enough to slice through Wall Street noise.
We see:
-
Rotation before it rotates
-
Catalysts before they explode
-
Turns before they trend
-
Opportunities while everyone else is still doom scrolling
This is the difference between traders and operators.
One guesses.
One reads the market like a playbook.
And it starts with using the right tools.
If you want to see what we see, the way we see it —
you need charts that don’t lie, lag, or limit your edge.
That means TradingView.
- Clean charts.
- Real-time data.
- Precision tools.
- Time Freedom Trading Custom Indicators - to "See" the MOVES correctly!
Everything you need to trade the turn, not chase the move.
👉 Sign up for TradingView today and start seeing the market like a Time Freedom Trader.
Your clarity starts the moment your charts go HD.
Because remember —
You’re just one trade away.

LIVE LIKE
A SUPER HERO!
A SUPER HERO!
If you’re ready... it’s time to level up.
Join our Coaching Cohort, where we teach traders how to:
- Think like a Trader and Investor
- Build your own "consistency code"
- Grow into Profits with Providence.
No more hesitation. Just a proven path to financial freedom.
Click below to join the Time Freedom Trading Coaching Cohort and start trading the $1KWay today!
Join the TIME FREEDOM TRADING Coaching Cohort Today!
Discover how Time Freedom Trading can help you start building your Financial Flywheel and your trading plan to HIT SIX in 2026!
Freedom awaits—are you ready to claim it?
| CLINTON "The Bald Bull" JAMES

P.S.S. PLEASE PAY IT FORWARD!
GIVE TIME FREEDOM - SHARE THIS LINK
Every one deserves Time Freedom!
If you know someone who would like to learn to earn time freedom, please forward this email / link and share the freedom!
Your network will appreciate it (and remember you) for sharing thoughtful content.
If you enjoyed this micro-lesson please share this link on social.


Get the "GET FREE" Bundle

10 TIME FREEDOM TRADING TACTICS YOU WILL LEARN!
- Learn your real freedom number to earn time freedom trading in the stock market. (it's smaller than you think!)
- Learn how to see market manipulation by large institutional investors and profit from their movements.
- Learn how to make money in an up, down, or sideways market. More importantly, you will learn a quantitative approach to know when NOT to trade in the stock market to protect your capital.
- Develop the proper paper trading skills and processes to prove your trading ability in the stock market before risking a single dollar!
- Learn the proper trading chart configurations to see the markets in 3D and clearly see market moves before your trade!
- Understand the difference between retail trading (prey) and professional trading (predator)strategies and how to profit from both mindsets in the stock market.
- Learn simple trading strategies that only require 5th-grade math. No complex calculations or buzzwords to confuse you.
- Create simple automated trading tactics with your
broker that allow you to place a simple trade on autopilot and minimize
your risk while maximizing your gain for a trade.
- Join a live daily trader community chat that will discuss market moves in real-time to accelerate your learning and close your experience gap faster.
- Experience the seasonality of the stock market with a veteran trader to learn how to profit in all months and seasons of the year to earn time freedom!
✓ Quantified Strategies: Learn to identify repeatable trading patterns to profit in the markets with systematic, data-driven methods.
✓ Practical Examples: Real-world cases, demonstrated strategies in action.
✓ Consistent Results: Strategies that have proven successful for decades are now accessible to you.




When your ready;
There are five (5) ways I can help.
1.0 Subscribe to
The W.ith T.ime F.reedom Report
Join the Time Freedom Trading Community. SIGN UP for The W.ith T.ime F.reedom REPORT newsletter and learn how to earn TIME FREEDOM from your INBOX! Get trading strategies and get elements of the Time Freedom Trading Operating System in your inbox! Time Freedom Awaits!
The W.ith T.ime F.reedom Report
2.0 Subscribe to
TIME FREEDOM TRADING TACTICS
Get an "investing lesson" on the 1st of every month in your inbox with simple tactics you can implement immediately to start earning time freedom.
TIME FREEDOM TRADING TACTICS
3.0 The Time Freedom Trading
ON DEMAND COURSES
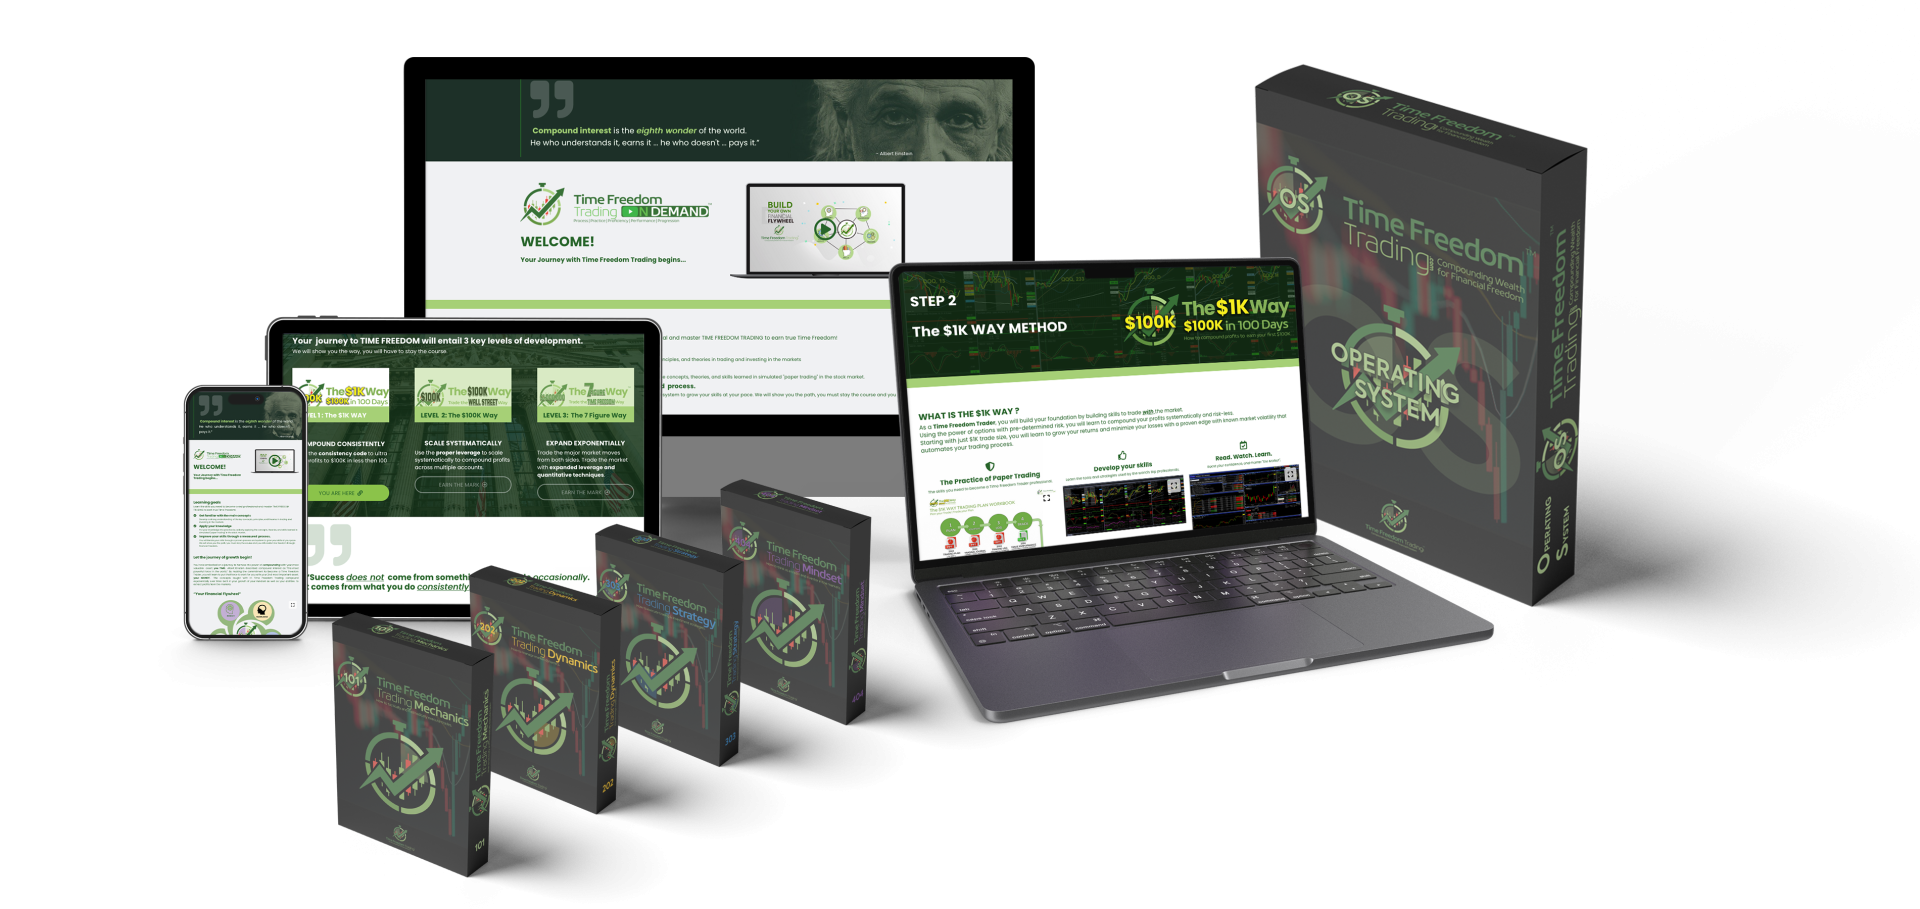
The #1 On-demand Trading Curriculum for learning Trading MECHANICS, Trading DYNAMICS, Trading STRATEGY, and Trading MINDSET.
Join the TIME FREEDOM TRADER COMMUNITY in our flagship courses. Time Freedom Trading teaches you exactly how to lose less and make more by learning a simple system to compound profits in the stock market.
Come inside and get over 25 years of trading expertise, proven methods, and actionable strategies to help Main Street earn Wall Street profits by trading and investing in the stock market.
Ondemand.TimeFreedomTrading.com
4.0 The Time Freedom Trading COACHING COHORT
Join Time Freedom Traders learning "live and in real-time" the seasonality of the stock market. This comprehensive Trader Coaching Cohort will teach you 1:1, in live Cohort sessions, and open office hours, specifically how to trade the seasons of the stock market and learn from live Market Moments for profitable trading strategies.
The WINTER, SPRING, SUMMER, and FALL seasons all have different dynamics to profit from in the stock market. Build the proper knowledge, process, and skills to leverage the exact system I used to gain TIME FREEDOM all year through by effectively trading the stock market with seasonal catalysts. Grow your account with real money with the $1K to $100K Way and earn time freedom your way.
Time Freedom Trading Coaching Cohort
5.0 The FREEDOM FRIENDS & FAMILY AFFILIATE PROGRAM

Join the Time Freedom Trading Affiliate Program at no cost to you, and GET PAID to share the gift of TIME FREEDOM with friends and family. Refer others to Time Freedom Trading and share your personal affiliate link ID to earn a commission on every offering we sell.
Help Time Freedom Trading scale to reach more TIME FREEDOM TRADERS and fund your $1K WAY to earn time freedom. Become a partner to scale the Time Freedom Trader Community.
Giving back and paying it forward with Time Freedom Trading is a WIN-WIN for all!
BECOME A FREEDOM FRIENDS & FAMILY AFFILIATE
"Wall Street never changes. The pockets change, the suckers change, the stocks change, but Wall Street never changes, because human nature never changes."
- Jesse Livermore

SUBSCRIBE TO THE NEWSLETTER
Join TIME FREEDOM TRADERS who are readers of
The W.ith T.ime F.reedom Report for exclusive tips, strategies, and resources to learn how to trade and invest in the stock market.
Register for the
FREEDOM FRIENDS & FAMILY
AFFILIATE PROGRAM!

Get More WTF REPORT!

26 DECISIONS THAT WILL DECIDE YOUR 2026
#45 STOP PAYING IGNORANCE TAX

NEW YEAR: UNCERTAIN TIMES. CERTAIN EDGE.

#44 YOUR TRAINING YOUR AI REPLACEMENT.

#4 FIVE (5) REASONS EVERYONE SHOULD LEARN TO TRADE THE STOCK MARKET

# 38 FIVE YEARS FROM NOW, YOU'LL ARRIVE SOMEWHERE!

#40 Feeling FOMO for Missing the NVIDIA AI Bubble?

Share this Article on:
Learn to Earn Time Freedom;
FREE TO LIVE YOUR LIFE YOUR WAY!

Join us today
Join us today
Join us today
THANK YOU
Join us today
Join us today
Join us today

Learn to earn and earn time freedom with your profits in the stock market. Time Freedom Trading is helping MAIN STREET earn WALL STREET profits through real trading and investing strategies.
Forget the dogma of "set it and forget it" tactics with passive investing that keeps your advisor rich with fees and your account balance diminished with under performing portfolio strategies.
Time Freedom trading is helping MAIN STREET earn WALL STREET PROFITS. Can you afford to NOT find out? What is your old way of investing really costing you. Get started with TIME FREEDOM TRADING today!
Sponsor this Newsletter!
Have questions?
Hit reply to this email and we'll help out!

You are receiving this note because you joined us at one of the Time Freedom Trading websites.
Copyright © www.TIMEFREEDOMTRADING.com
All rights reserved.
About www.TIMEFREEDOMTRADING.com
THE TIME FREEDOM TRADING SYSTEM empowers Main Street with Wall Street knowledge and tools to compound wealth and earn time freedom through proven trading and investing strategies. Learning how the stock market works from the inside is critical to compounding wealth consistently in any market environment. Time Freedom Trading empowers you to build your own financial flywheel based upon your skills and goals. Regardless of the technology or market volatility, with TIME FREEDOM TRADING you will have the right mentor and mental coach who will reveal the patterns in human nature that don’t repeat but do rhyme which you can profit from. Whether it’s stocks, options, exchange-traded funds (ETFs), or futures, we empower you with an effective skill set and tools for everyone at every level of experience to earn time freedom.
Life is short.
MAKE IT WORTH WHILE!
Compounding wealth with Time Freedom Trading can make it long and worthwhile.
Earn time freedom to enjoy life, enjoy your family, and enable the life and legacy you deserve.
Become a Time Freedom Trader Today!
Your Time Freedom Awaits!
TIME FREEDOM TRADING DOES NOT PROVIDE RECOMMENDATIONS OR ADVICE.
FOR EDUCATIONAL AND INFORMATION PURPOSES ONLY; NOT ADVICE. TIME FREEDOM TRADING content is offered for educational and informational purposes only and should NOT be construed as a securities-related offer or solicitation or be relied upon as personalized financial advice. We are not financial advisors and cannot give personalized advice. There is a risk of loss in all trading, and you may lose some or all of your original investment. Results presented are not typical. Please review the full risk disclaimer
LEGAL DISCLAIMERS
ADDITIONAL RISKS