
Read More of
The GET F.R.E.E. Report
Friday July 31st, 2026

WEEK 31
July 27th, 2026
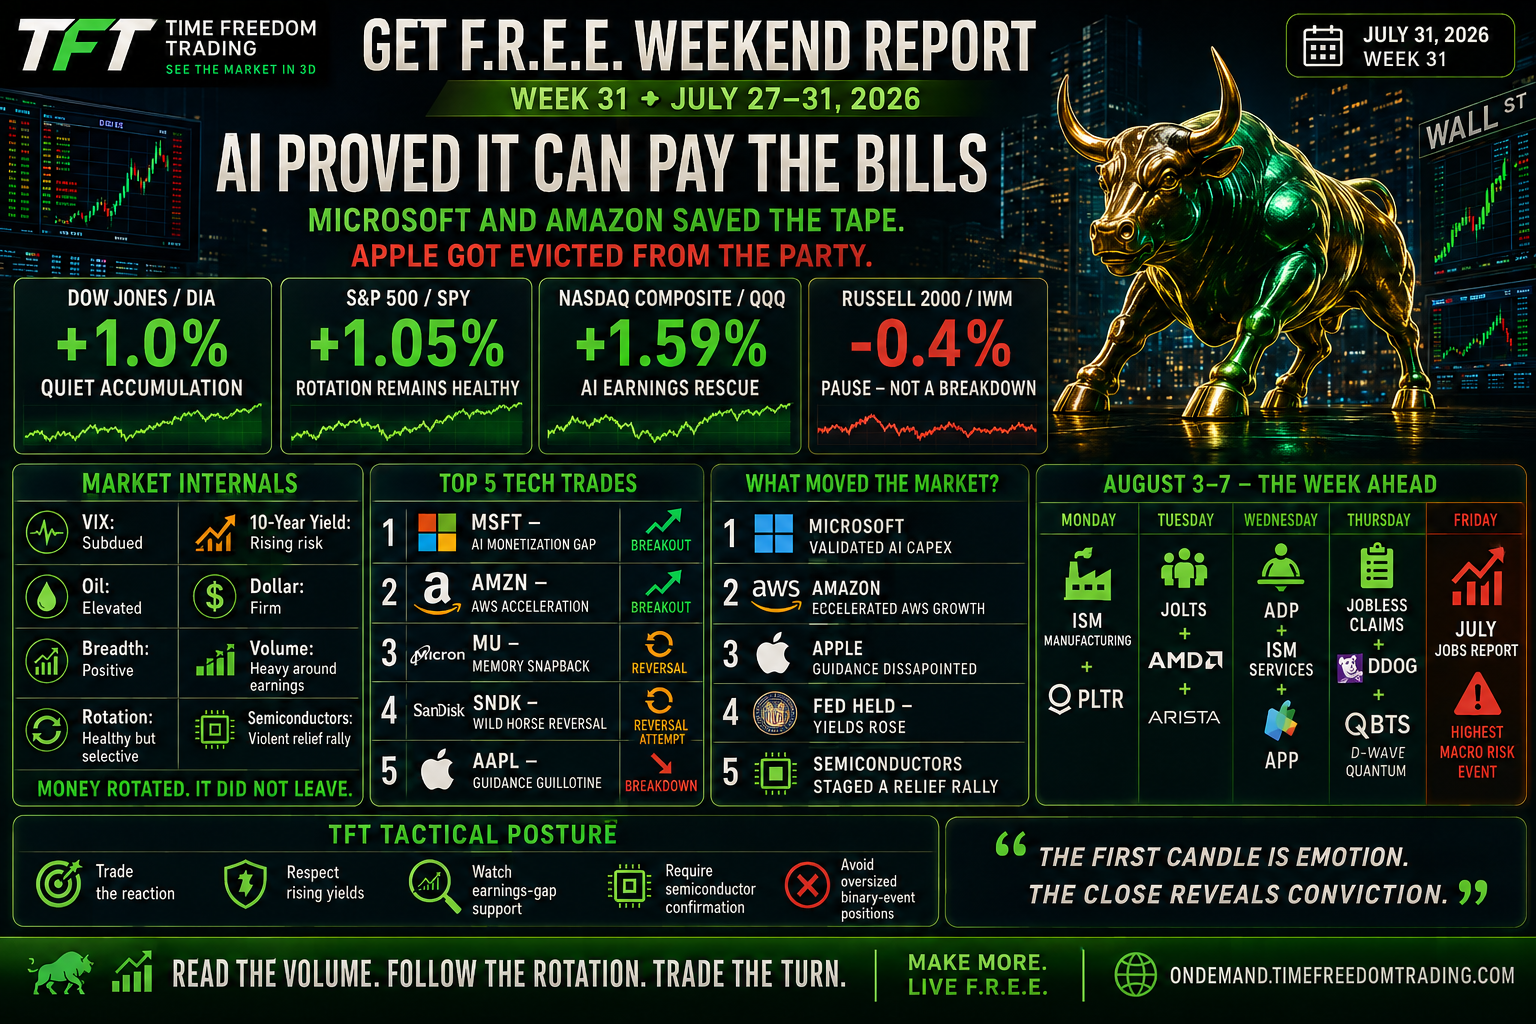
“THE AI BAR JUST GOT RAISED.
WALL STREET WANTS PROFITS,
NOT POWER-POINTS."
Wall Street spent the first half of the week acting like someone found a rattlesnake under the trading desk.
Then Microsoft and Amazon reminded everyone why AI remains the biggest capital allocation story on Earth.
By Friday afternoon, fear had turned into FOMO.
This wasn't a "buy everything" rally.
This was a reward the winners and punish the tourists rally.
Apple stumbled after disappointing guidance while Amazon delivered exactly what institutions wanted to hear—AI spending is beginning to translate into real business growth.
Investors suddenly remembered there's a difference between building AI... and actually monetizing it.
Meanwhile, oil stayed elevated, Treasury yields continued creeping higher, and inflation concerns never really left the room. The market simply decided earnings mattered more—for now.
WEEKLY INDEX SCORECARD
| Index | Weekly Change | YTD | Milestone | TFT Read |
|---|---|---|---|---|
| DIA (Dow) | +1.0% | +9.2% | New closing high | Industrials continue quietly leading |
| SPY (S&P 500) | +1.0% | +9.4% | New record close | Broad market remains healthy |
| QQQ (Nasdaq) | +1.6% | +9.2% | Earnings rescue rally | AI winners separating from losers |
| IWM (Russell 2000) | Flat | +18.1% | Still leading YTD | Small caps paused, not broken |
WEEKLY INDEX READ
The week began defensive.
Midweek turned emotional.
Friday became a buying stampede.
Classic earnings-season behavior.
Dow Jones
The Dow continues acting like the adult in the room.
Money keeps rotating toward industrials, financials and value names whenever mega-cap tech becomes expensive.
That tells us institutions are not leaving equities.
They're simply changing seats.
S&P 500
The S&P keeps proving one important lesson:
Breadth is healthier than the headlines suggest.
Even while Apple sold off sharply, enough sectors participated to keep the index advancing.
Healthy markets rotate.
Weak markets collapse.
This week looked like rotation.
Nasdaq
This was the tale of two AI markets.
Companies proving AI monetization exploded higher.
Companies merely promising future AI potential were punished.
Amazon and Microsoft effectively bailed out the technology complex.
Apple reminded investors that even trillion-dollar companies can disappoint.
Expect this "prove it" environment to continue through earnings season.
Russell 2000
Small caps took a breather.
That isn't necessarily bearish.
After a huge year-to-date run, digestion is normal.
Watch whether money rotates back into small caps once earnings season winds down.
WEEKLY MARKET INTERNALS
| Internal | Weekly Read | TFT Translation |
|---|---|---|
| Dow | Bullish | Quiet accumulation continues |
| S&P 500 | Bullish | Institutions still buying dips |
| Nasdaq | Bullish with higher volatility | AI leadership becoming selective |
| Russell 2000 | Neutral | Pause after strong advance |
| VIX | Relatively subdued | Fear never became panic |
| 10-Year Treasury | Higher yields | Bonds still worried about inflation |
| U.S. Dollar | Firm | Dollar strength remains a headwind |
| WTI Crude | Elevated | Inflation risk refuses to disappear |
| Gold | Mixed | Safe-haven demand cooled |
| Bitcoin | Stable | Crypto waiting for next catalyst |
| Market Breadth | Positive | More stocks participating than last week |
| Volume | Heavy during earnings | Institutions were active |
| Sector Rotation | Healthy | Money rotated —not exited |
This wasn't a momentum chase.
This was institutional repositioning.
Volume expanded.
Leadership shifted.
Weak hands sold headlines.
Strong hands bought earnings.
That's exactly what professionals want to see.
SECTOR ROTATION READ
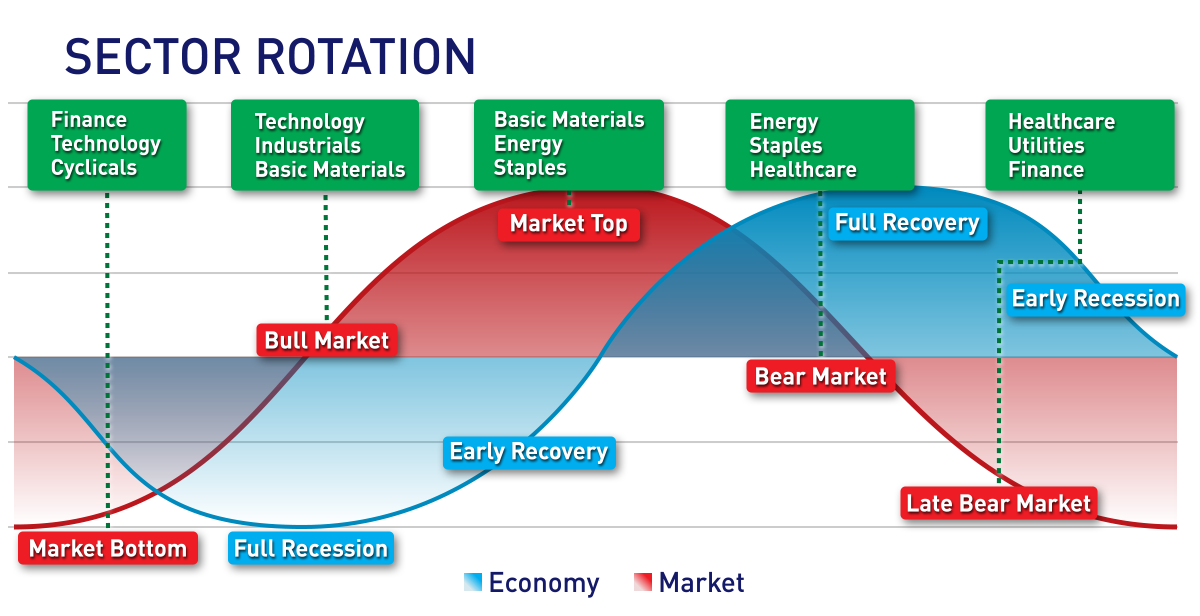
Current Phase:
Late Bull Market Rotation
Characteristics:
- Leadership rotating instead of collapsing
- Institutions rewarding profitability
- AI narrative evolving into AI execution
- Higher yields becoming more important
-
Stock picking matters more than index buyin
Most traders spent this week asking:
"Where is the market going?"
Professionals asked something completely different:
"Where is the money moving?"
One question creates opinions.
The other creates wealth.
Your paycheck has one employee.
Your portfolio can have thousands.
Which one is working harder this weekend?
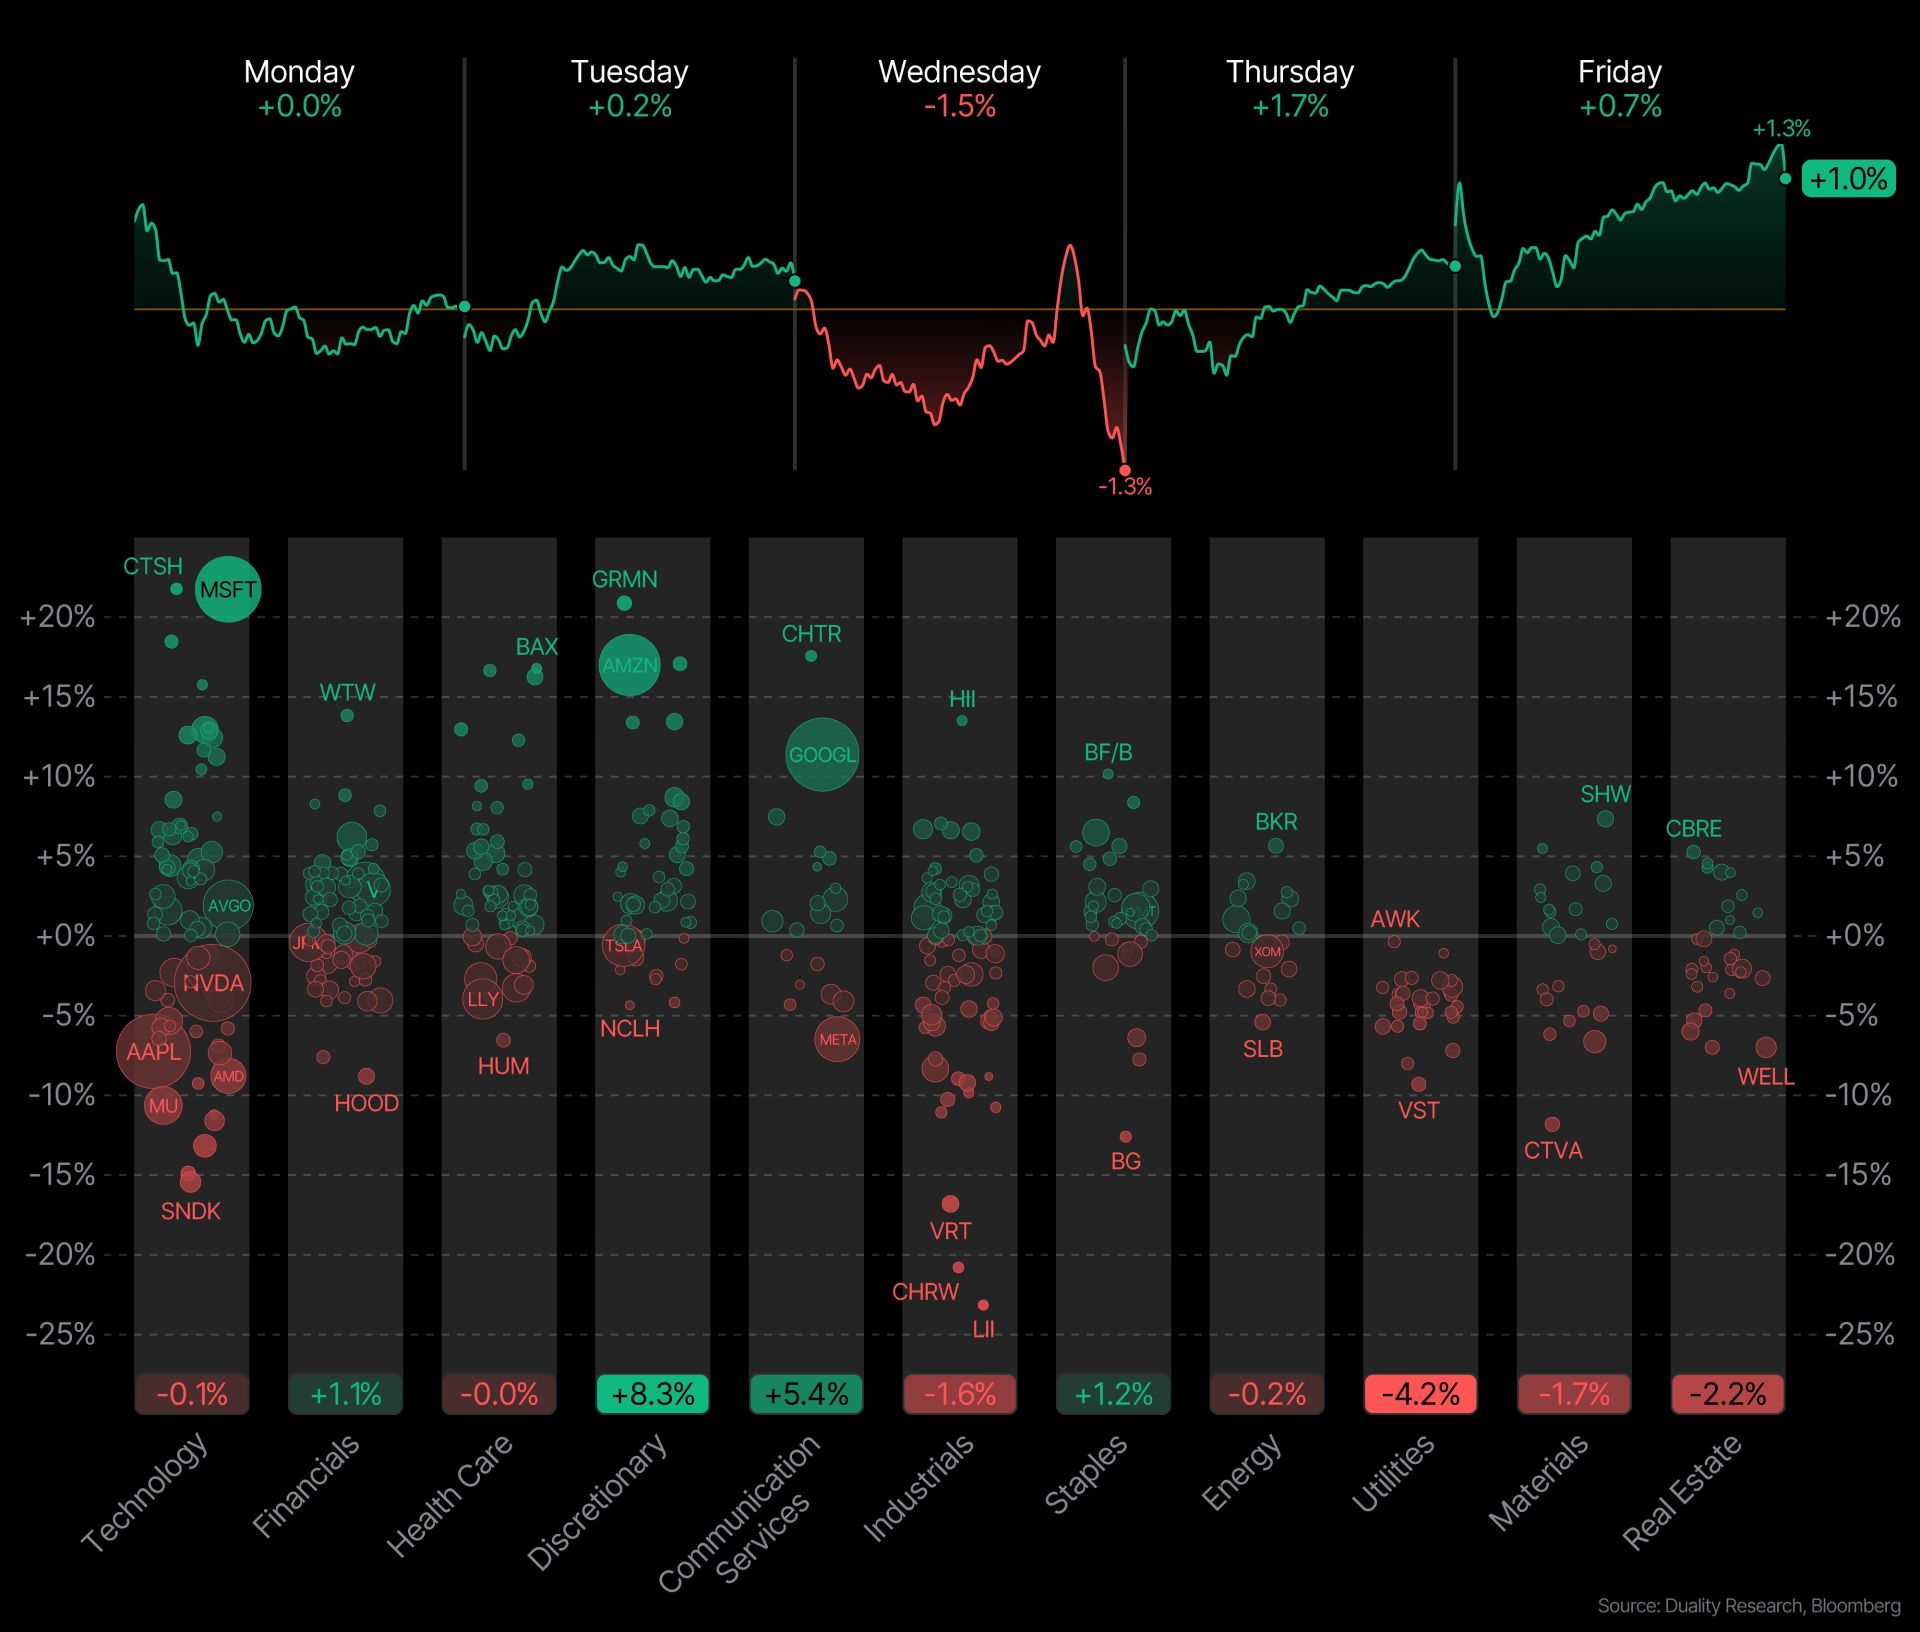
POSITIVE SECTORS
| Sector | Weekly Tone | TFT Read |
|---|---|---|
| Consumer Discretionary | Strong | Amazon carried the flag |
| Industrials | Bullish | Institutions still accumulating |
| Financials | Bullish | Higher yields helping |
| Energy | Bullish | Oil supporting earnings |
| Cloud Infrastructure | Bullish | AI spending validated |
NEGATIVE SECTORS
| Sector | Weekly Tone | TFT Read |
|---|---|---|
| Consumer Electronics | Weak | Apple guidance disappointment |
| Legacy Semiconductors | Mixed | Institutions becoming selective |
| Defensive Growth | Weak | Valuation reset continues |
| Utilities | Mixed | Money preferred cyclicals |
MARKET HEAT MAP - LIVE
WEEK 31 SUMMARY
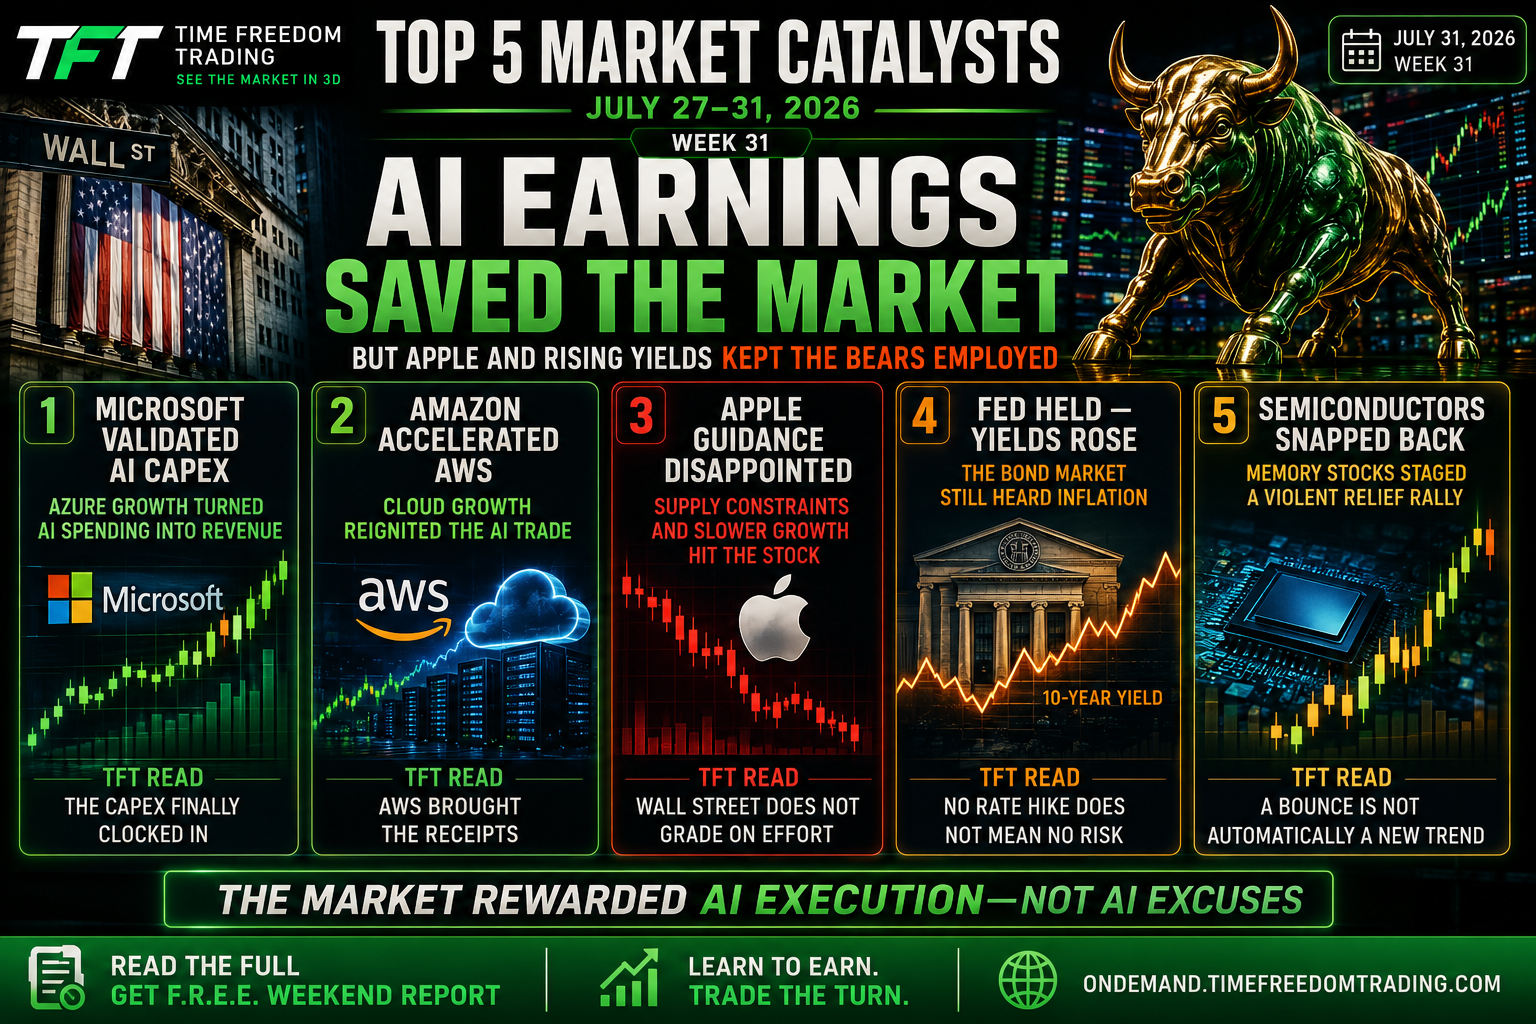
TOP 5 Key Catalysts That Moved The Week
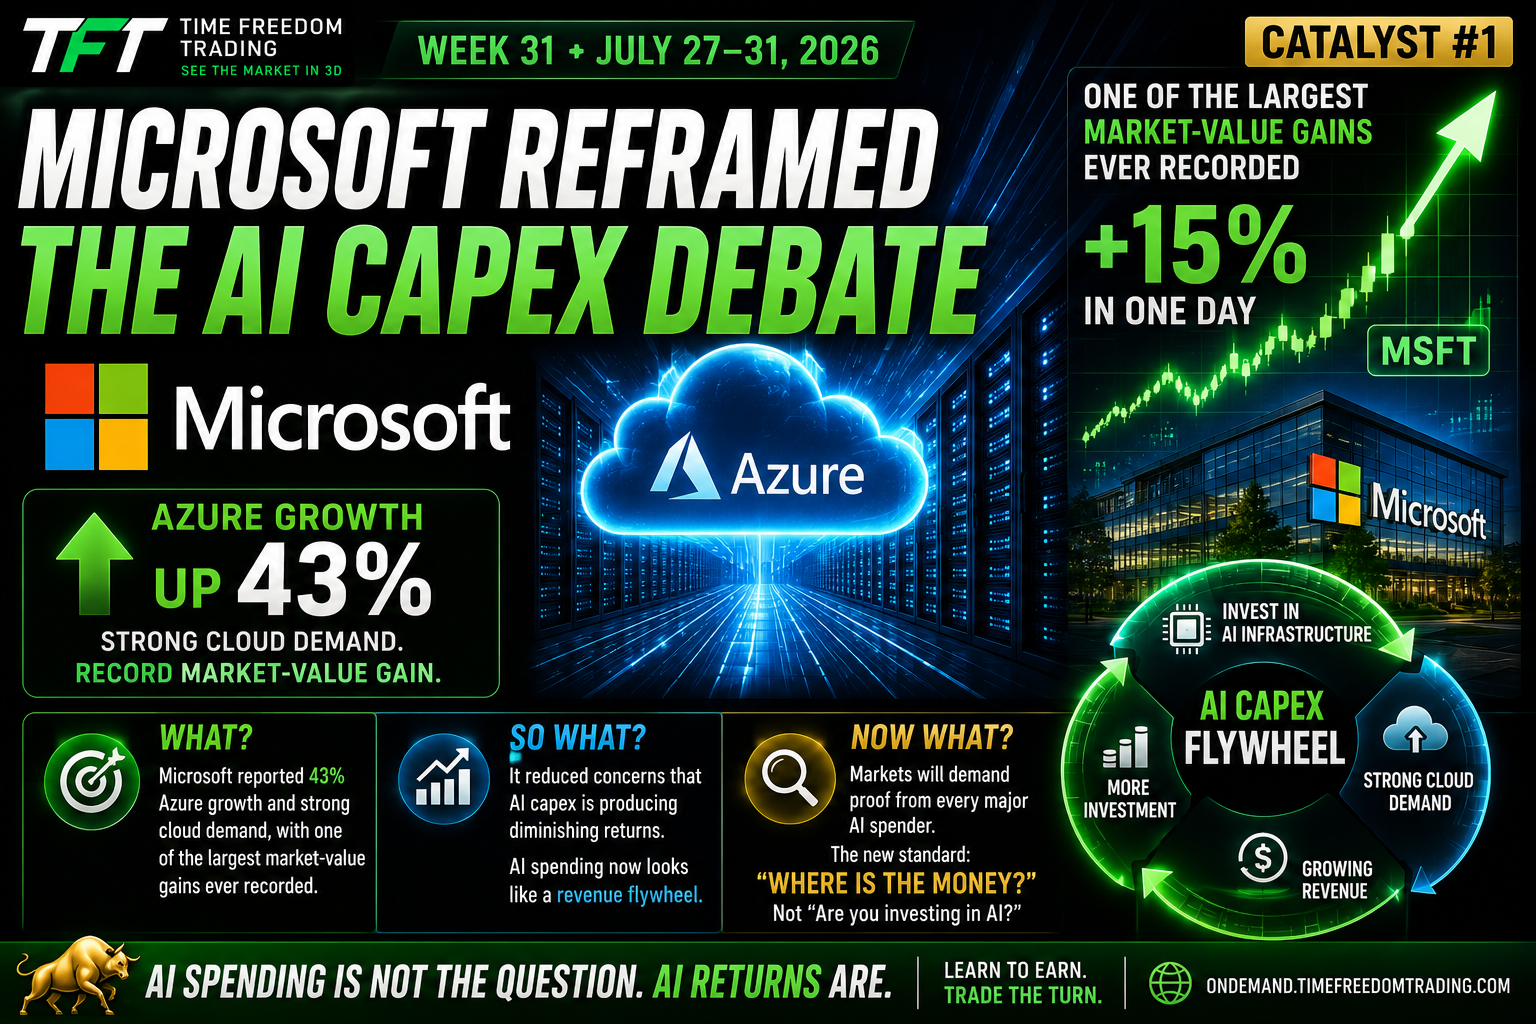
1. MICROSOFT REFRAMED THE AI CAPEX DEBATE
What?
Microsoft reported 43% Azure growth and strong cloud demand, while its shares experienced one of the largest market-value gains ever recorded.
So What?
The report reduced concerns that hyperscaler capital spending was producing diminishing returns.
AI spending suddenly looked less like reckless expansion and more like a functioning revenue flywheel.
Now What?
Markets will demand similar proof from every major AI spender.
The new standard is no longer:
“Are you investing in AI?”
It is:
“Where is the money?”
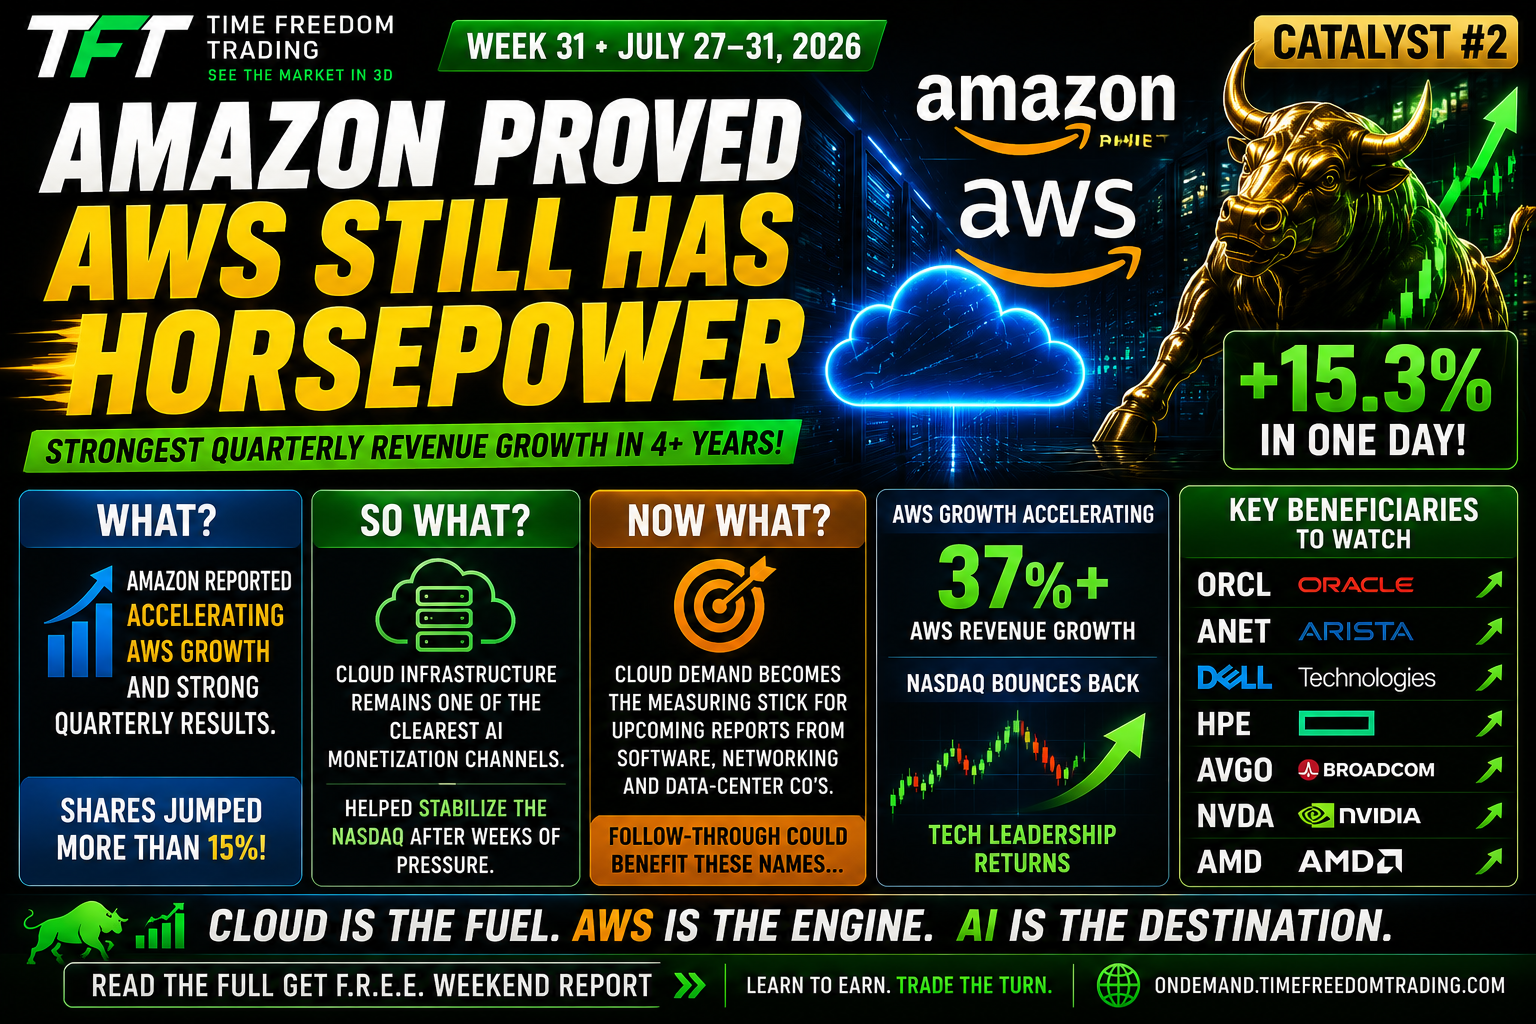
2. AMAZON PROVED AWS STILL HAS HORSEPOWER
What?
Amazon reported accelerating AWS growth and delivered its strongest quarterly revenue growth in more than four years. Shares jumped more than 15%.
So What?
Amazon reinforced the view that cloud infrastructure remains one of the clearest AI monetization channels.
It also helped stabilize the Nasdaq after weeks of pressure across semiconductors and high-growth technology.
Now What?
Cloud demand becomes the measuring stick for upcoming reports from software, networking and data-center companies.
Follow-through could benefit:
- ORCL
- ANET
- DELL
- HPE
- AVGO
- NVDA
-
AMD
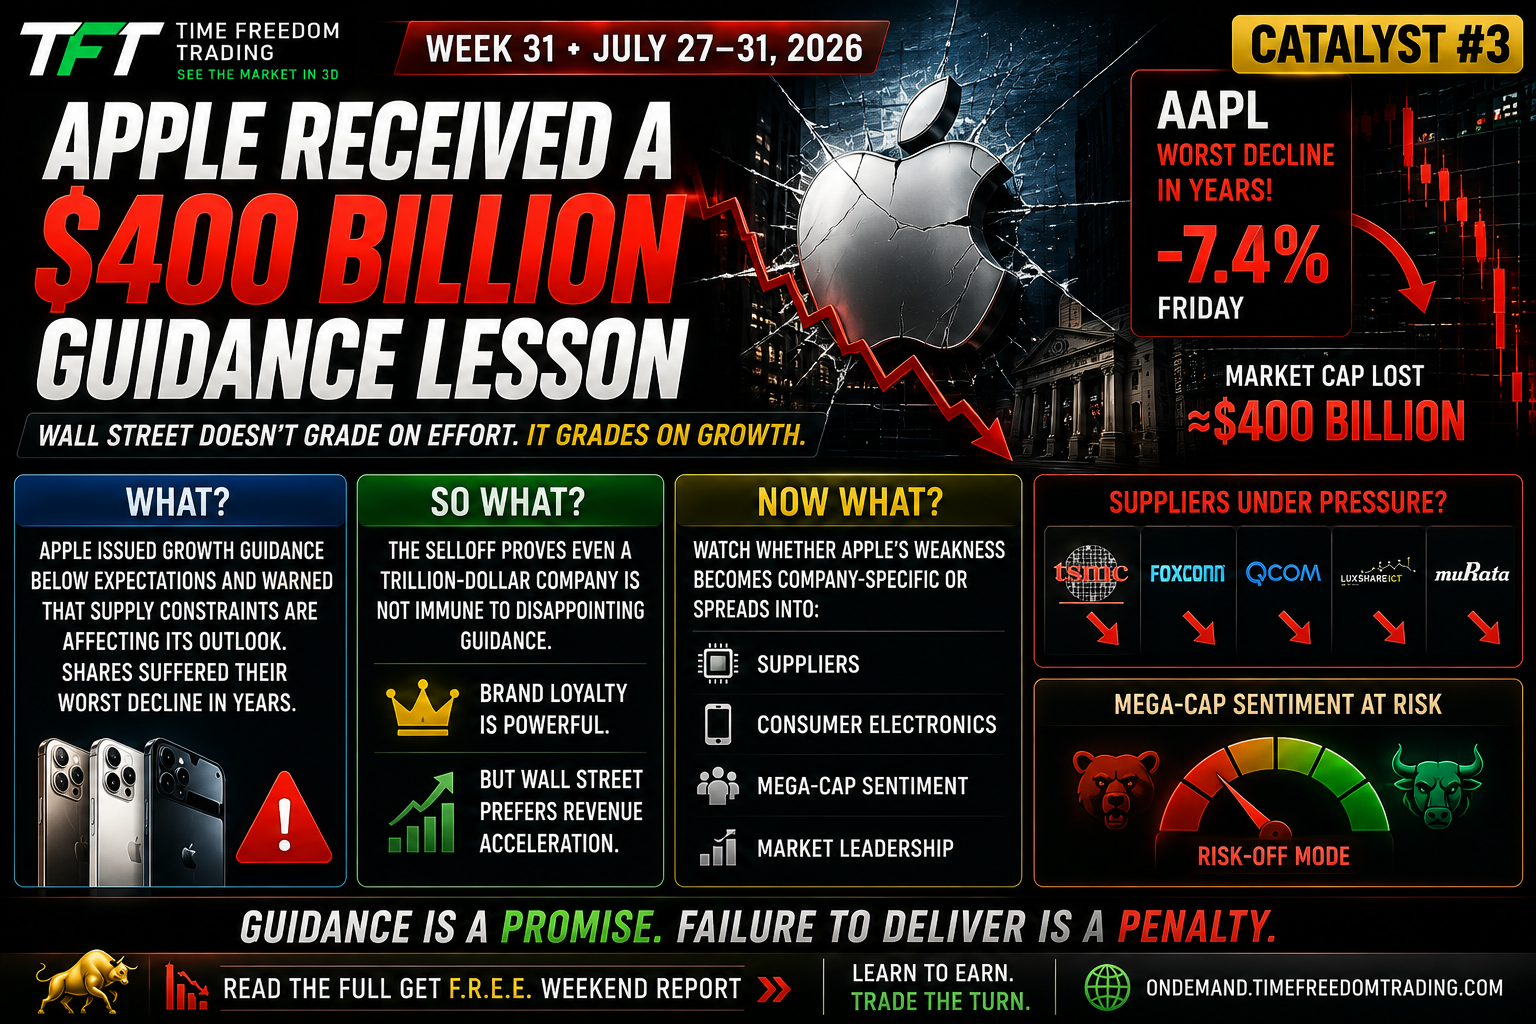
3. APPLE RECEIVED A $400 BILLION GUIDANCE LESSON
What?
Apple issued growth guidance below expectations and warned that supply constraints were affecting its outlook. Shares suffered their worst decline in years.
So What?
The selloff demonstrated that trillion-dollar market capitalization does not provide immunity from disappointing guidance.
Brand loyalty is powerful.
But Wall Street prefers revenue acceleration.
Now What?
Watch whether Apple’s weakness becomes company-specific or spreads into suppliers, consumer electronics and mega-cap sentiment.
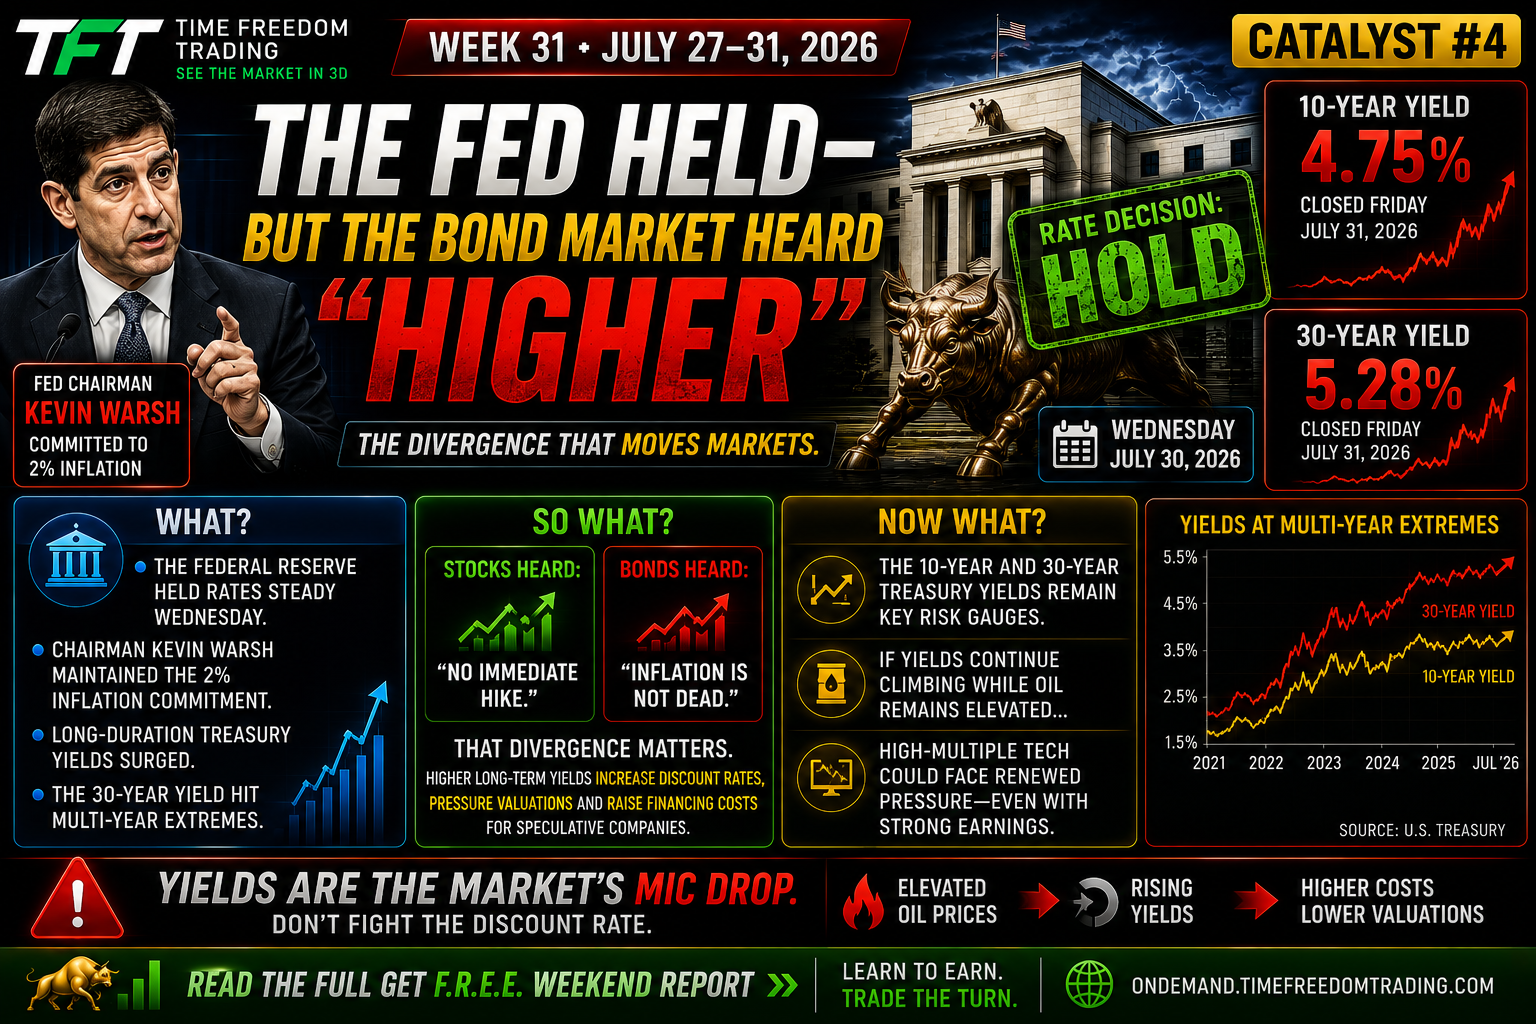
4. THE FED HELD—BUT THE BOND MARKET HEARD “HIGHER”
What?
The Federal Reserve held rates steady Wednesday, while Chairman Kevin Warsh maintained the 2% inflation commitment. Long-duration Treasury yields surged, with the 30-year yield reaching multi-year extremes.
So What?
Stocks heard:
“No immediate hike.”
Bonds heard:
“Inflation is not dead.”
That divergence matters because higher long-term yields increase discount rates, pressure valuations and raise financing costs for speculative companies.
Now What?
The 10-year and 30-year Treasury yields remain key risk gauges.
If yields continue climbing while oil remains elevated, high-multiple technology could face renewed pressure even with strong earnings.
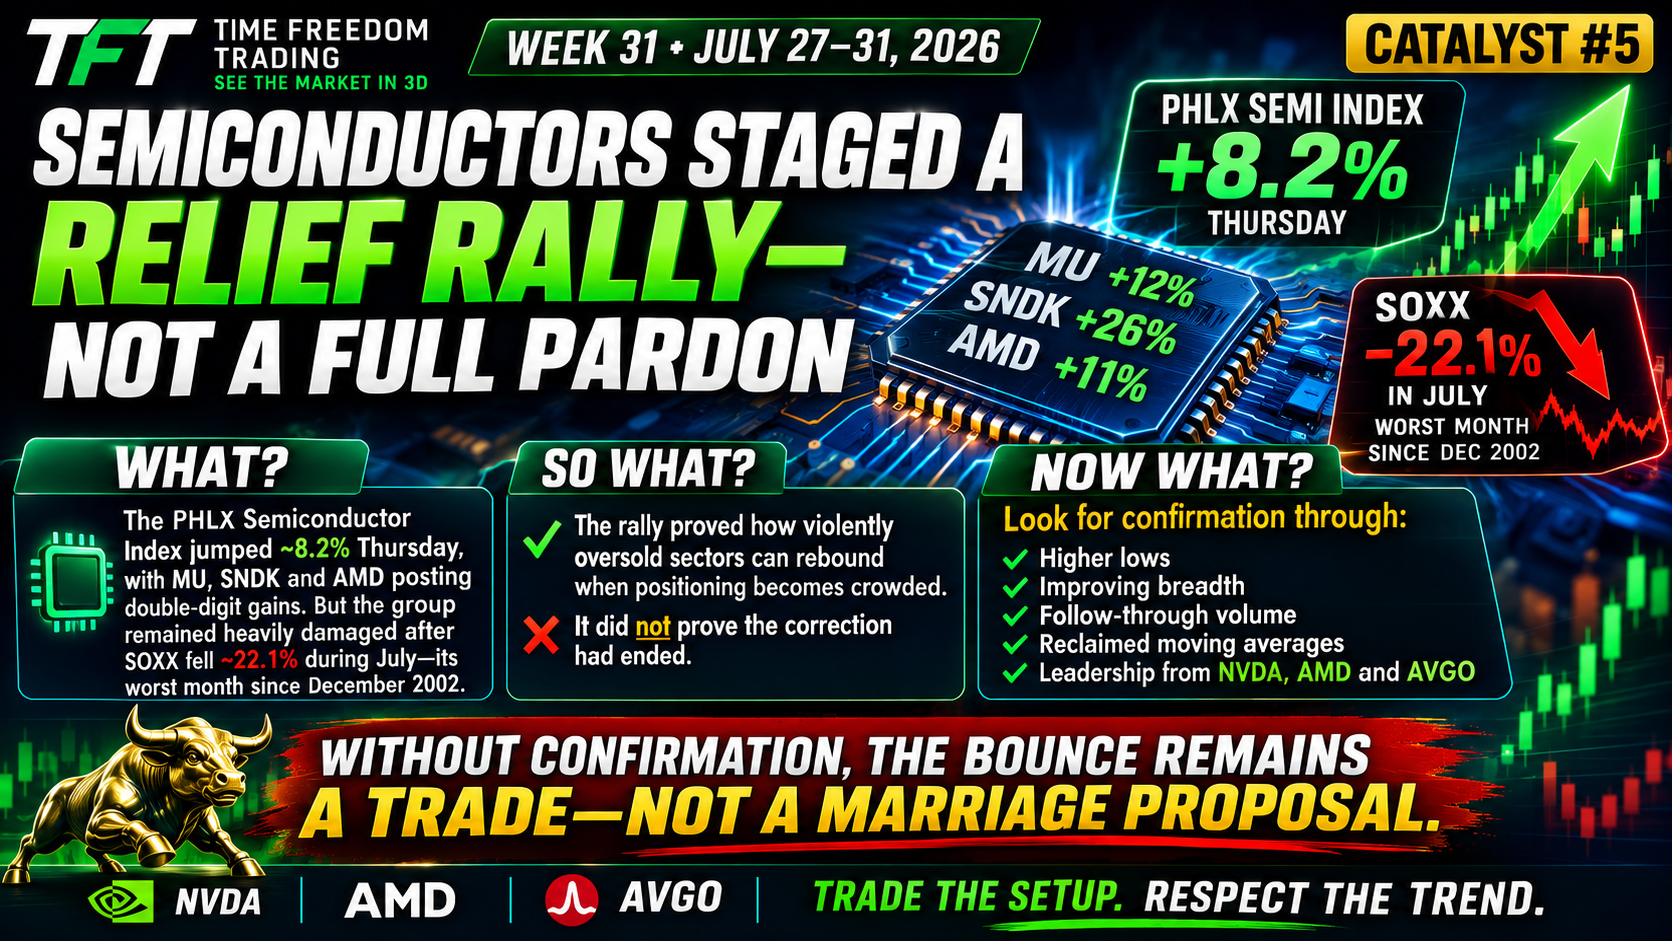
5. SEMICONDUCTORS STAGED A RELIEF RALLY—NOT A FULL PARDON
What?
The PHLX Semiconductor Index jumped approximately 8.2% Thursday, with MU, SNDK and AMD posting double-digit gains. But the group remained heavily damaged after SOXX fell approximately 22.1% during July—its worst month since December 2002.
So What?
The rally proved how violently oversold sectors can rebound when positioning becomes crowded.
It did not prove the correction had ended.
Now What?
Look for confirmation through:
- Higher lows
- Improving breadth
- Follow-through volume
- Reclaimed moving averages
- Leadership from NVDA, AMD and AVGO
Without confirmation, the bounce remains a trade—not a marriage proposal.
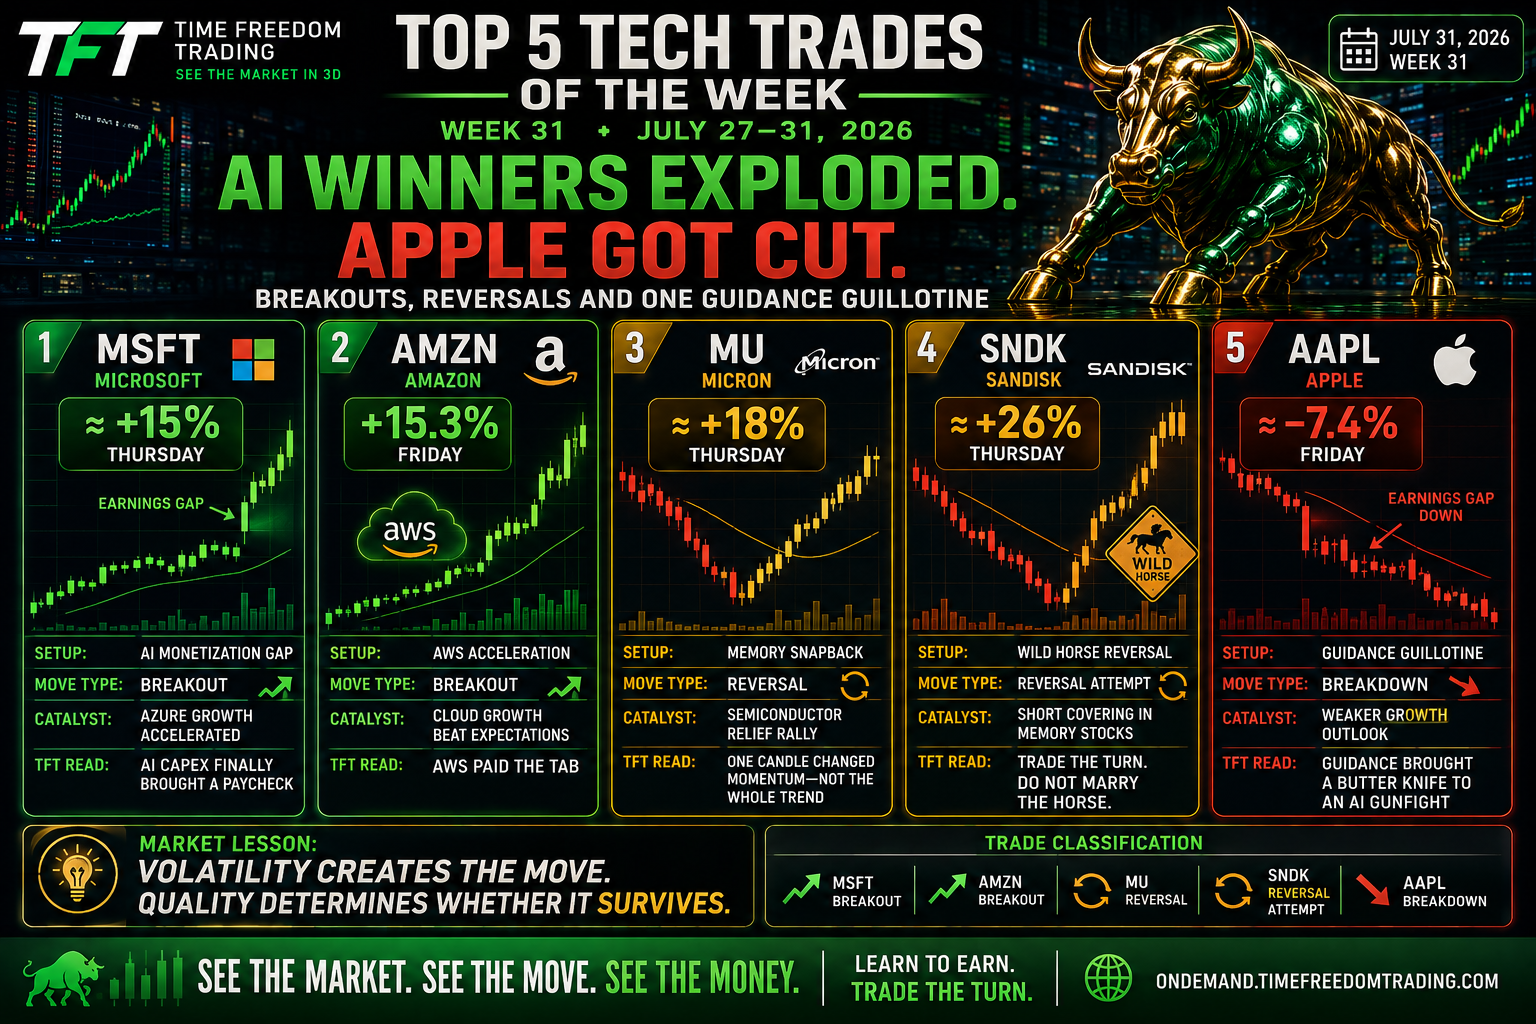
KEY TRADES OF THE WEEK:
NASDAQ TECH MOVERS
THE TAPE HELD AN AI AUDITION.
Microsoft and Amazon showed Wall Street the receipts.
Apple showed up with excuses.
Memory stocks delivered a face-ripping rebound after spending most of July getting beaten like they owed the market money.
This week was not about blindly buying technology.
It was about identifying which companies converted AI spending into measurable growth—and which companies were still selling expensive bedtime stories.
The narrative gets attention.
The numbers get institutional money.
| Rank | Ticker | Key Move | Catalyst Metric | Setup | TFT Read |
|---|---|---|---|---|---|
| 1 | MSFT | +15.5% | Azure +43% | AI Monetization Gap | AI capex finally clocked in |
| 2 | AMZN | +15.3% | AWS +37% | AWS Acceleration | Cloud brought the receipts |
| 3 | MU | +18% | SOX +8.2% | Memory Snapback | One candle changed momentum |
| 4 | SNDK | +26% | SOX +8.2% | Wild Horse Reversal | Trade the bounce; respect the damage |
| 5 | AAPL | −7.4% | Weak guidance | Guidance Guillotine | Wall Street grades future growth |
TOP 5 TRADES
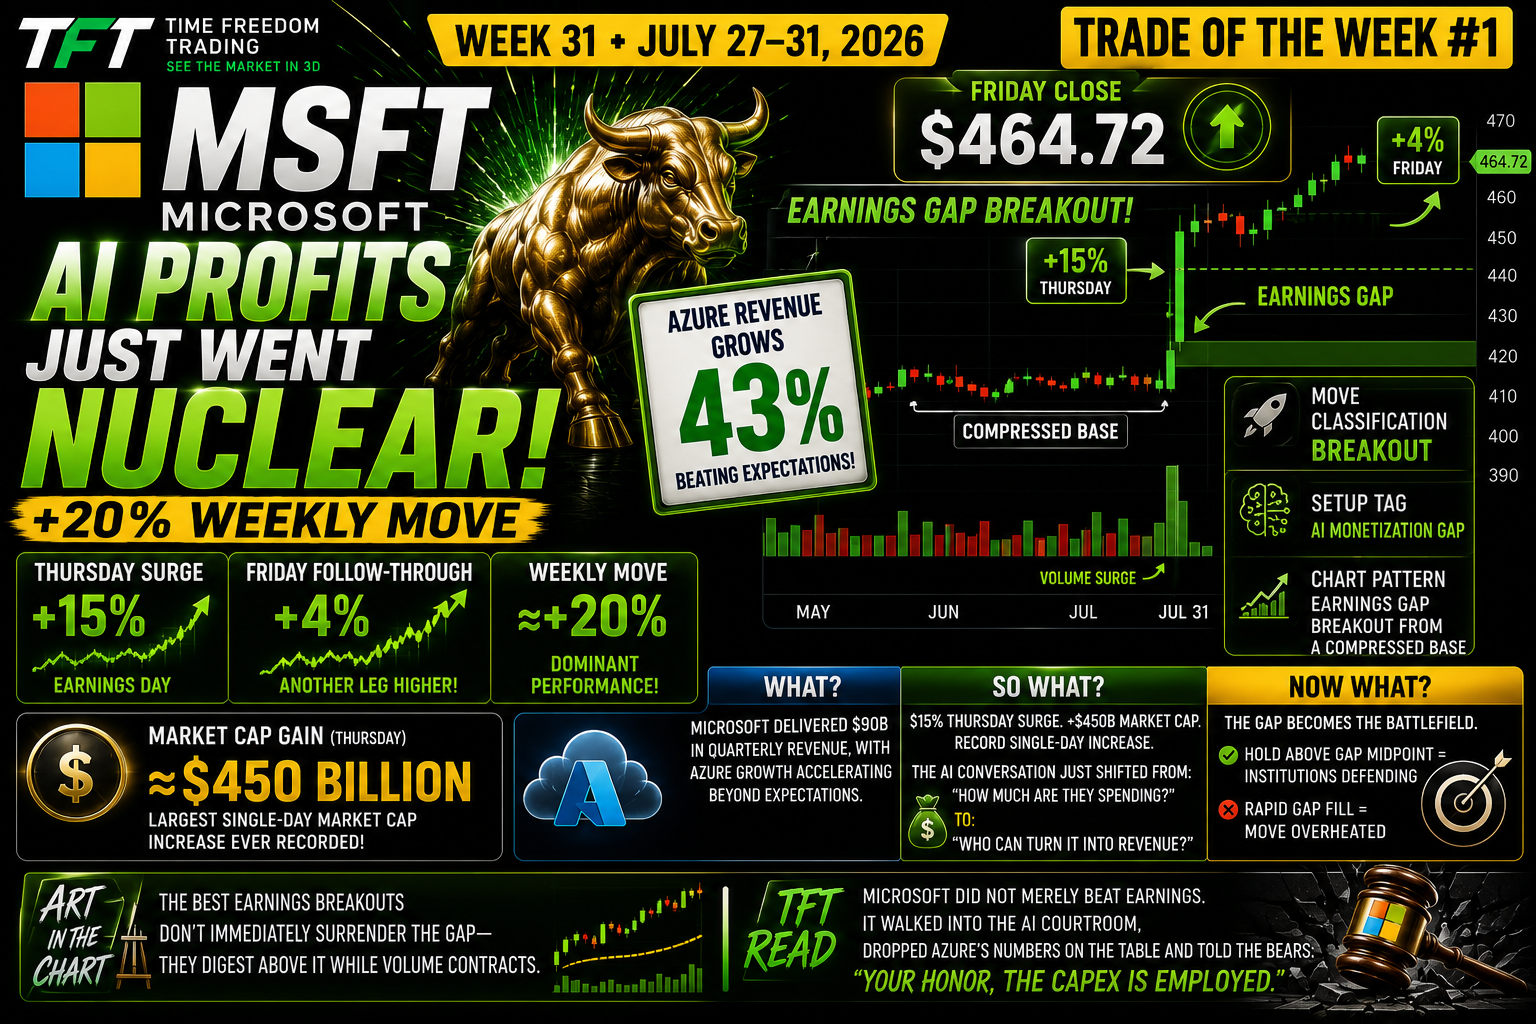
1. MSFT — Microsoft
- Weekly move: Approximately +20%
- Notable move: Roughly +15% Thursday, followed by another gain Friday
- Friday close: $464.72
- Catalyst: Azure revenue grew 43%, beating expectations and easing fears that Microsoft’s enormous AI infrastructure spending was becoming an expensive science project.
- Chart pattern: Earnings gap breakout from a compressed base
- Move classification: Breakout
-
Setup tag: AI Monetization Gap
What?
Microsoft delivered quarterly revenue of approximately $90 billion, with Azure growth accelerating beyond Wall Street’s expectations. Investors interpreted the report as proof that AI infrastructure spending is generating real demand and cash flow—not merely producing keynote applause.
So What?
Microsoft gained roughly 15% during Thursday’s session and added approximately $450 billion in market capitalization, reportedly setting a record for the largest single-day increase in market value by a public company. The stock continued higher Friday and closed at $464.72.
That move did more than reward Microsoft shareholders.
It changed the market’s AI conversation from:
“How much are these companies spending?”
To:
“Which companies can turn that spending into revenue?”
Now What?
The gap becomes the battlefield.
A healthy consolidation above the earnings-gap midpoint would show institutions are defending the new valuation.
A rapid gap fill would suggest the move became emotionally extended.
Art in the Chart
The best earnings breakouts do not immediately surrender the gap—they digest above it while volume contracts.
TFT Read
Microsoft did not merely beat earnings.
It walked into the AI courtroom, dropped Azure’s numbers on the table and told the bears:
“Your Honor, the capex is employed.”
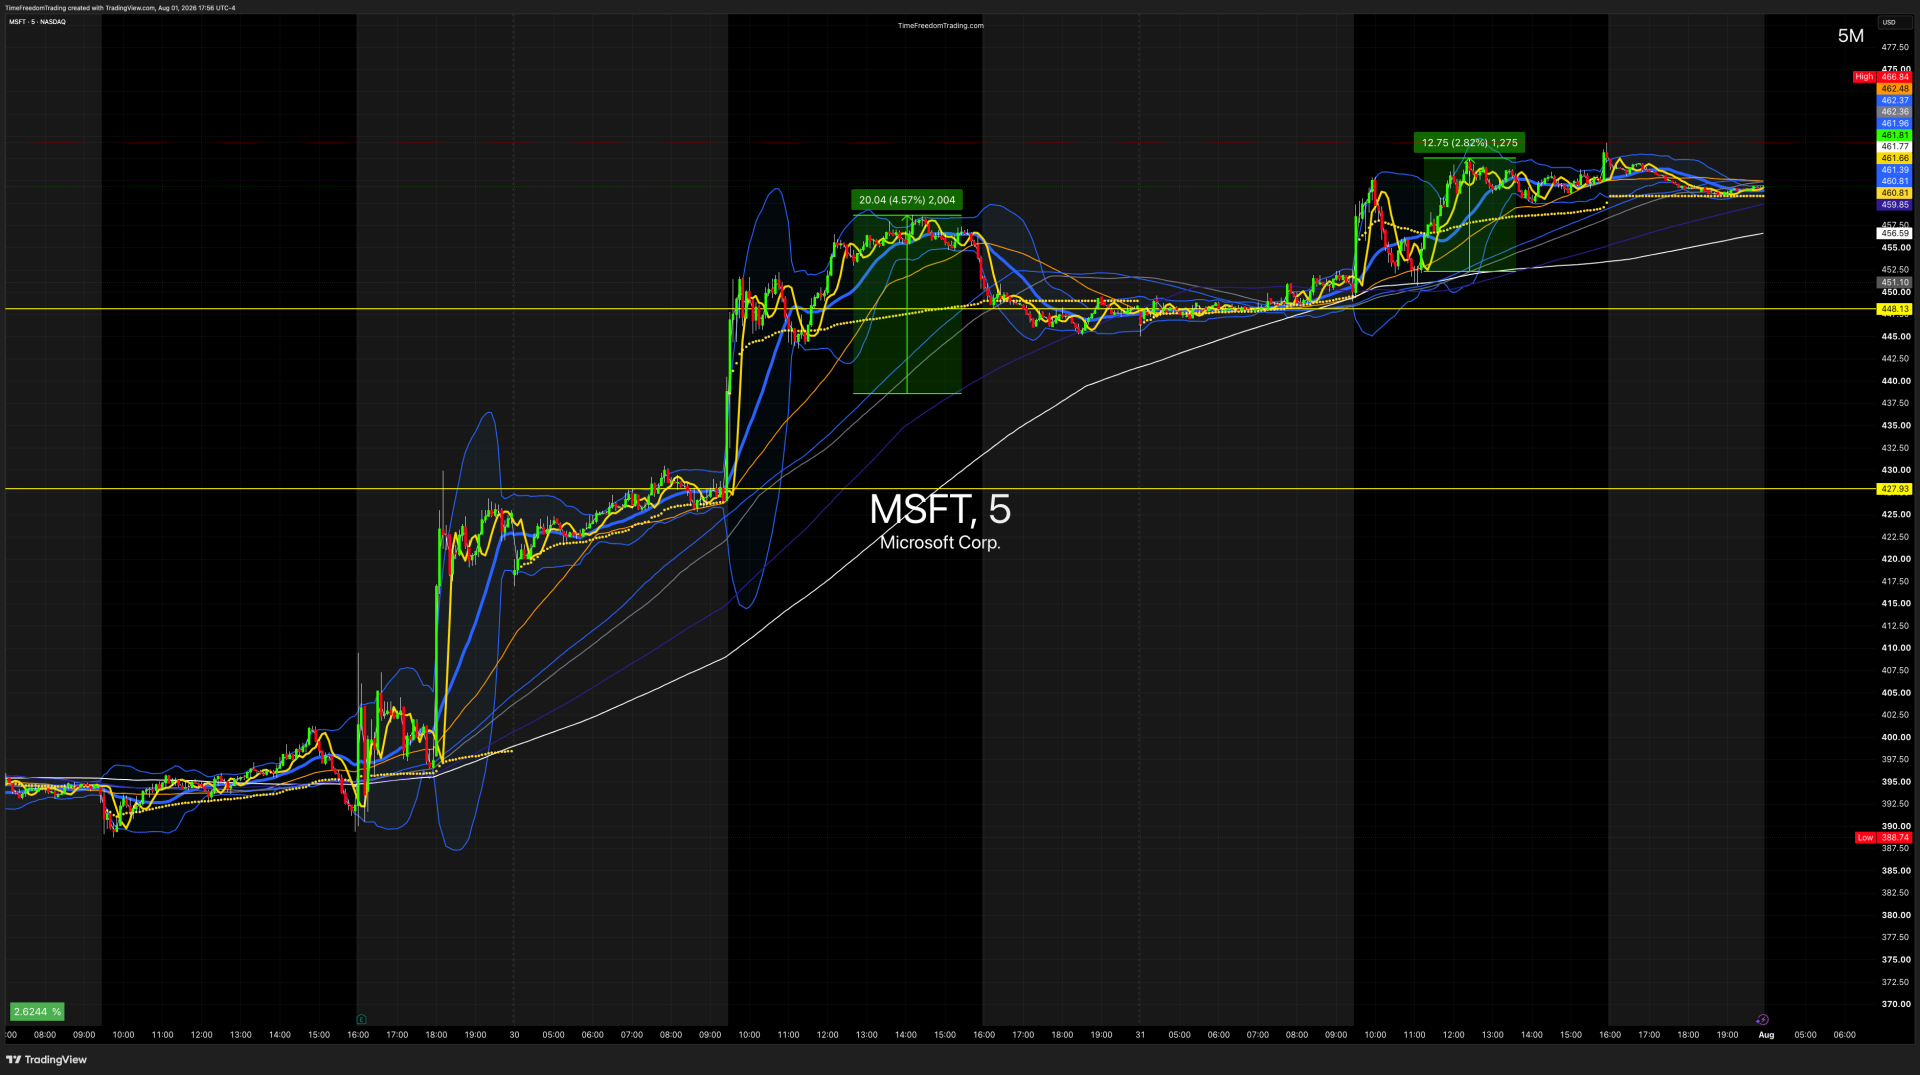
| Metric | Value |
|---|---|
| Direction | 🟢 Bullish |
| Friday Close | $464.72 |
| Thursday Earnings Move | +15.5% |
| Friday Follow-Through | +2.4% |
| Approx. Two-Day Move | +18.3% |
| Primary Catalyst | Azure Revenue Growth +43% / Strong AI Cloud Demand |
| Trade Setup | Earnings Gap Breakout |
| Ideal Entry | First pullback that holds the earnings gap |
| Confirmation | Higher low above VWAP with expanding volume |
| Ideal Strategy | Bull Call Debit Spread or Long Calls |
| Invalidation | Gap fill below Thursday's earnings gap |
| Market Environment | Institutional AI Accumulation |
| Relative Volume (RVOL) | Extremely High |
| Institutional Read | Aggressive Accumulation |
| Trade Grade | ⭐⭐⭐⭐⭐ (A+) |
| 1K WAY™ Setup | AI Monetization Gap |
2. AMZN — Amazon
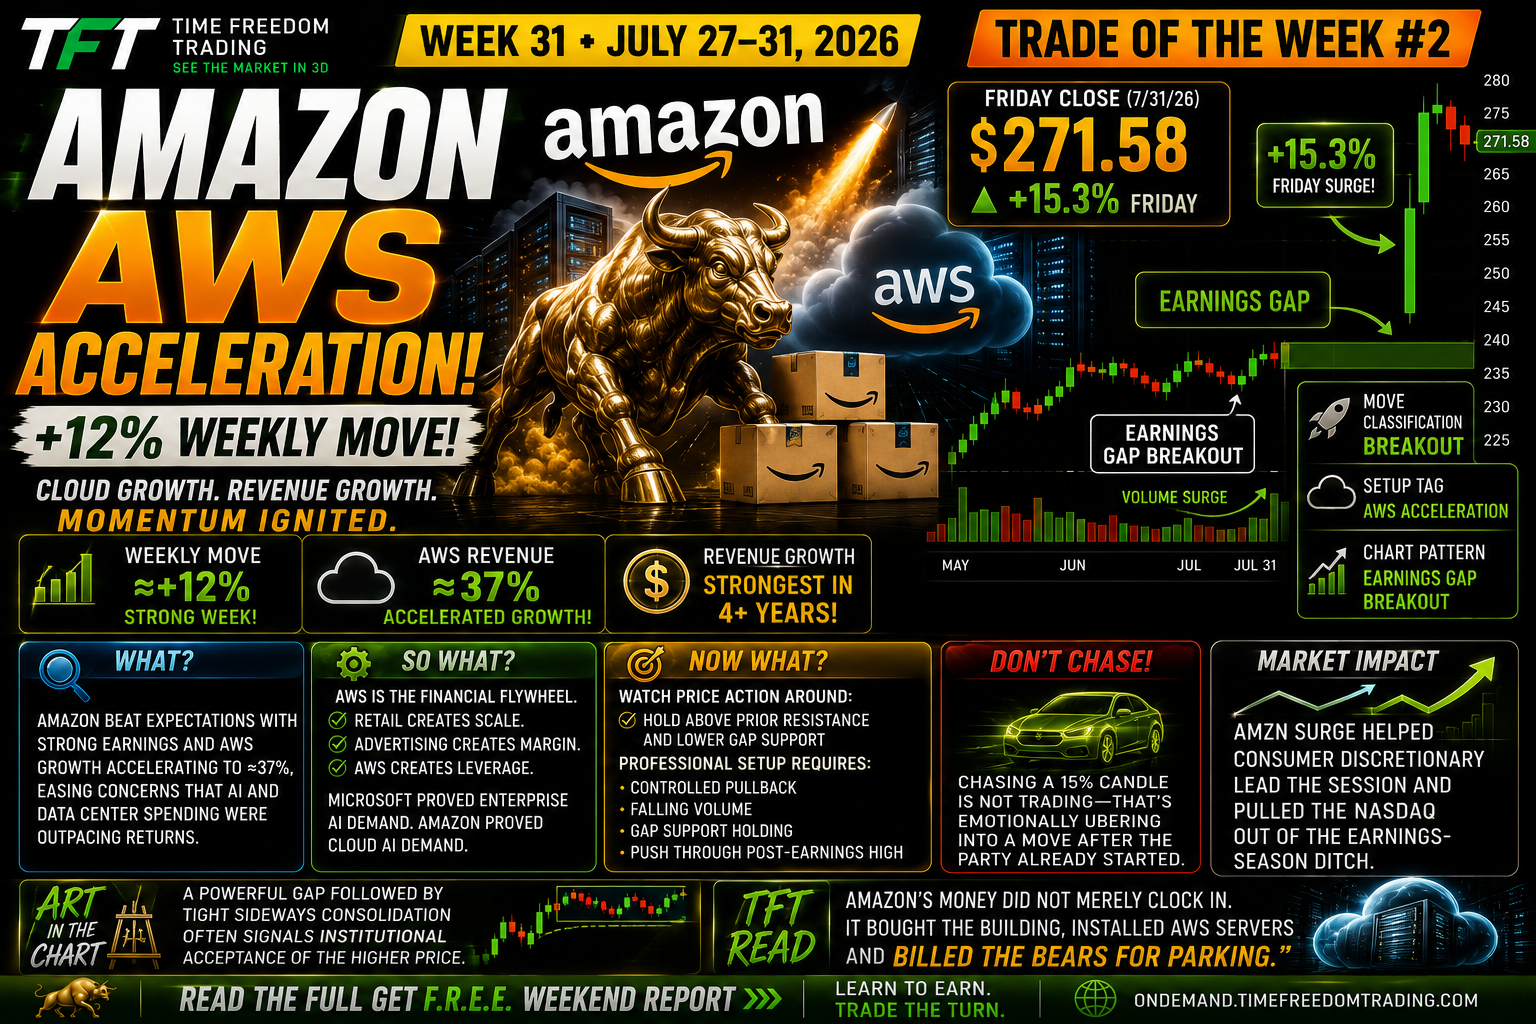
- Weekly move: Approximately +12%
- Friday move: +15.3%
- Friday close: Approximately $271.58
- Catalyst: AWS revenue grew approximately 37%, while Amazon delivered its strongest quarterly revenue growth in more than four years.
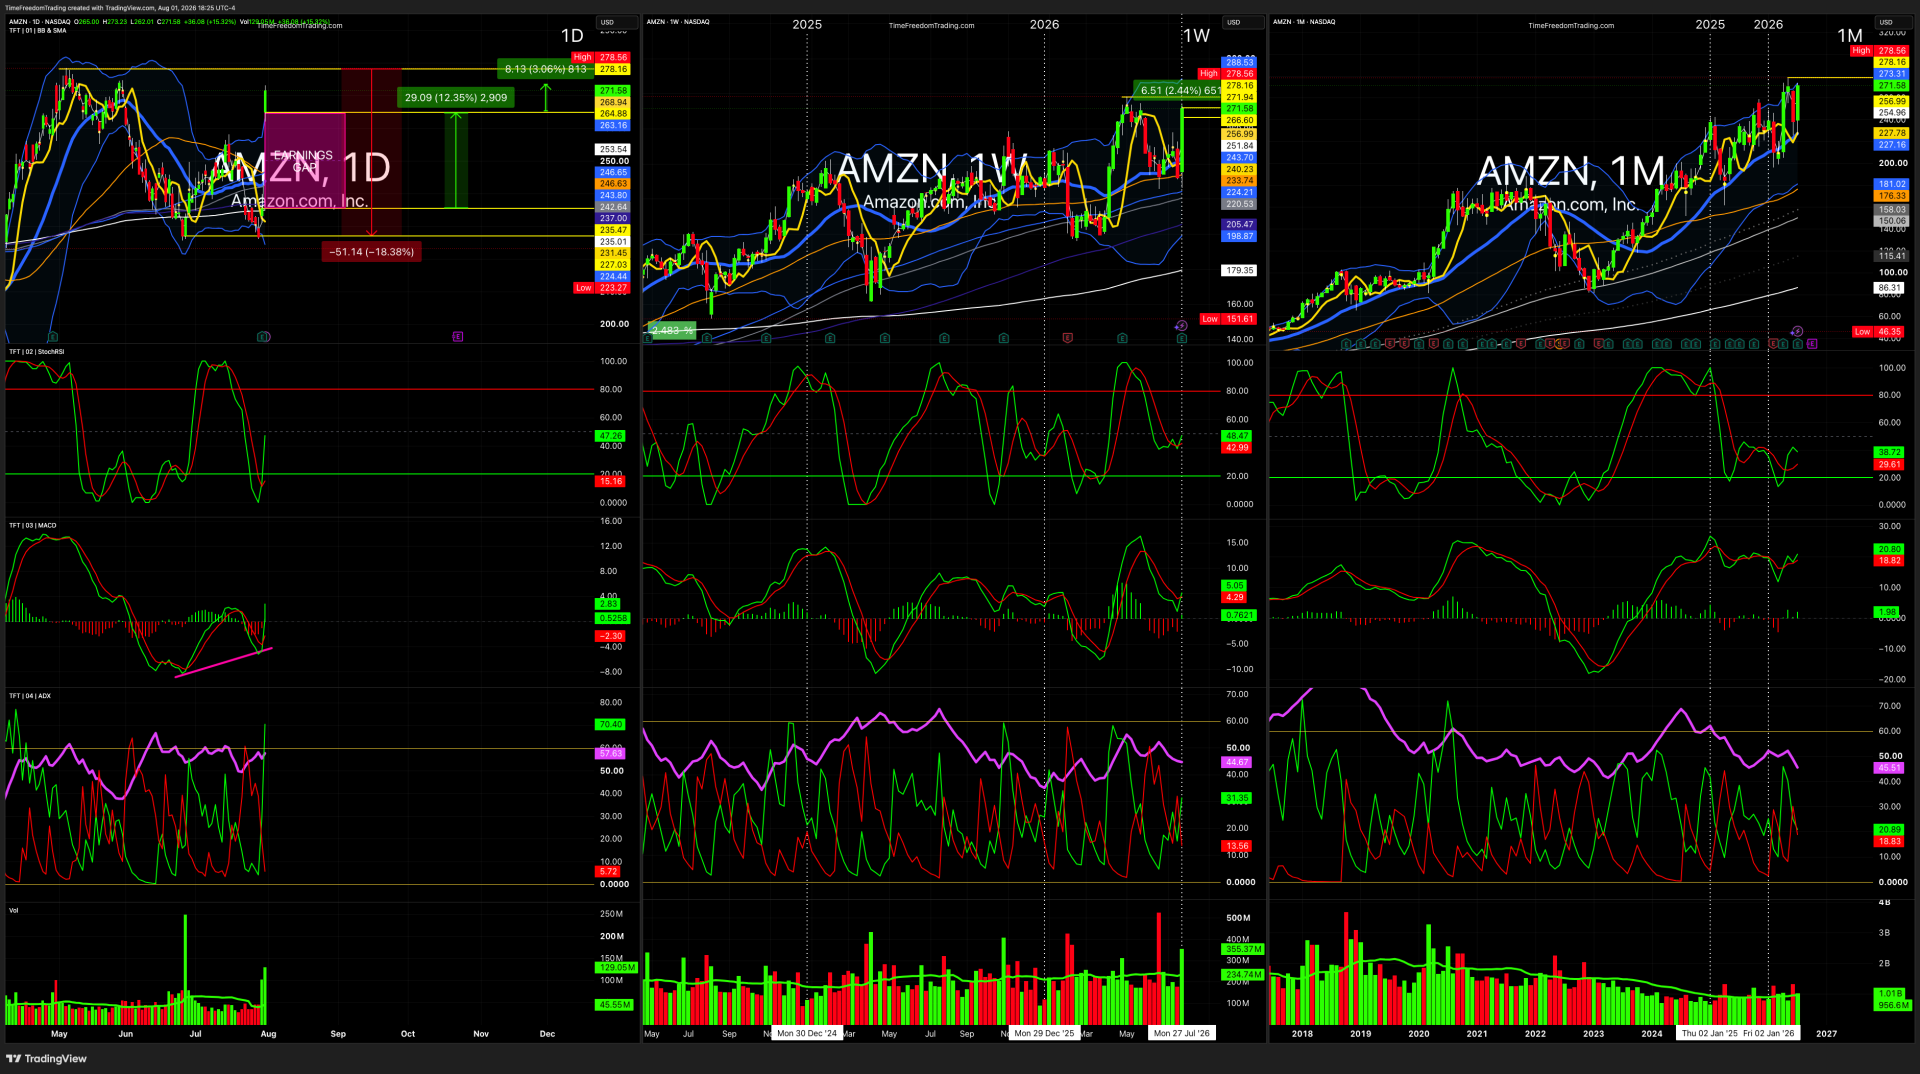
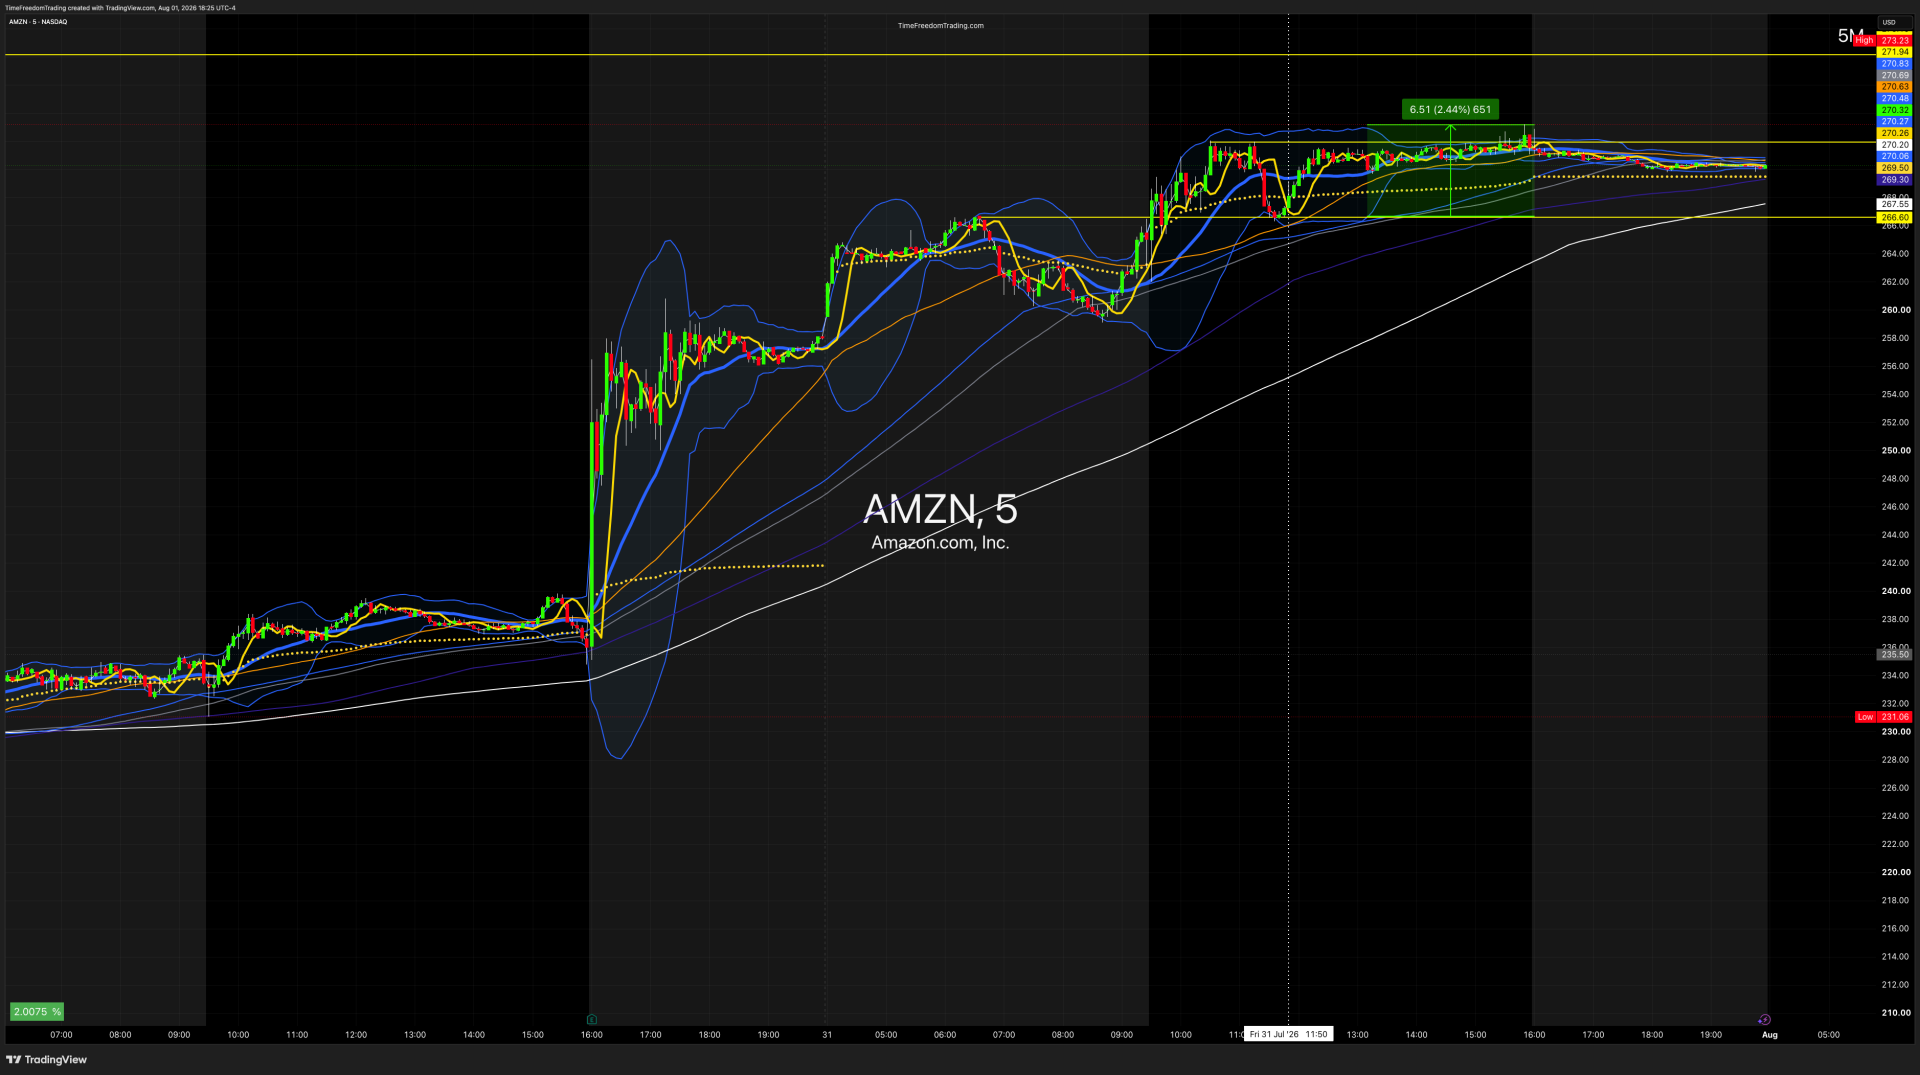
- Chart pattern: Earnings gap breakout
- Move classification: Breakout
-
Setup tag: AWS Acceleration
What?
Amazon reported much stronger earnings than expected, while AWS growth accelerated to approximately 37%. That eased concerns that Amazon’s massive spending on AI and data centers was outrunning the economic return.
Amazon shares surged approximately 15.3% Friday, helping consumer discretionary become one of the session’s strongest sectors.
So What?
AWS is the Financial Flywheel inside Amazon.
Retail creates scale.
Advertising creates margin.
AWS creates operating leverage.
When cloud growth accelerates, investors stop viewing Amazon’s capital expenditures as a cost and start viewing them as a future revenue factory.
Microsoft validated enterprise AI demand.
Amazon validated cloud AI demand.
Together, they dragged the Nasdaq out of the earnings-season ditch.
Now What?
Watch whether AMZN can hold above the prior resistance zone and the lower portion of Friday’s earnings gap.
Chasing a 15% candle is not trading.
That is emotionally Ubering into a move after the party already started.
The professional setup comes from:
- A controlled pullback
- Falling volume
- Gap support holding
-
A renewed push through the post-earnings high
Art in the Chart
A powerful gap followed by tight sideways consolidation often signals institutional acceptance of the higher price.
TFT Read
Amazon’s money did not merely clock in.
It bought the building, installed AWS servers and billed the bears for parking.
| Metric | Value |
|---|---|
| Direction | 🟢 Bullish |
| Friday Close | ≈ $271.58 |
| Friday Earnings Move | +15.3% |
| Approx. Weekly Move | ≈ +12% |
| Primary Catalyst | AWS Revenue +37% / Strongest Revenue Growth in 4+ Years |
| Trade Setup | Earnings Gap Breakout |
| Ideal Entry | Pullback into gap support |
| Confirmation | Gap holds with institutional buying |
| Ideal Strategy | Bull Call Spread |
| Invalidation | Gap closes below earnings low |
| Market Environment | Cloud Leadership Rotation |
| Relative Volume (RVOL) | Extremely High |
| Institutional Read | Institutional Accumulation |
| Trade Grade | ⭐⭐⭐⭐⭐ (A+) |
| 1K WAY™ Setup | AWS Acceleration |
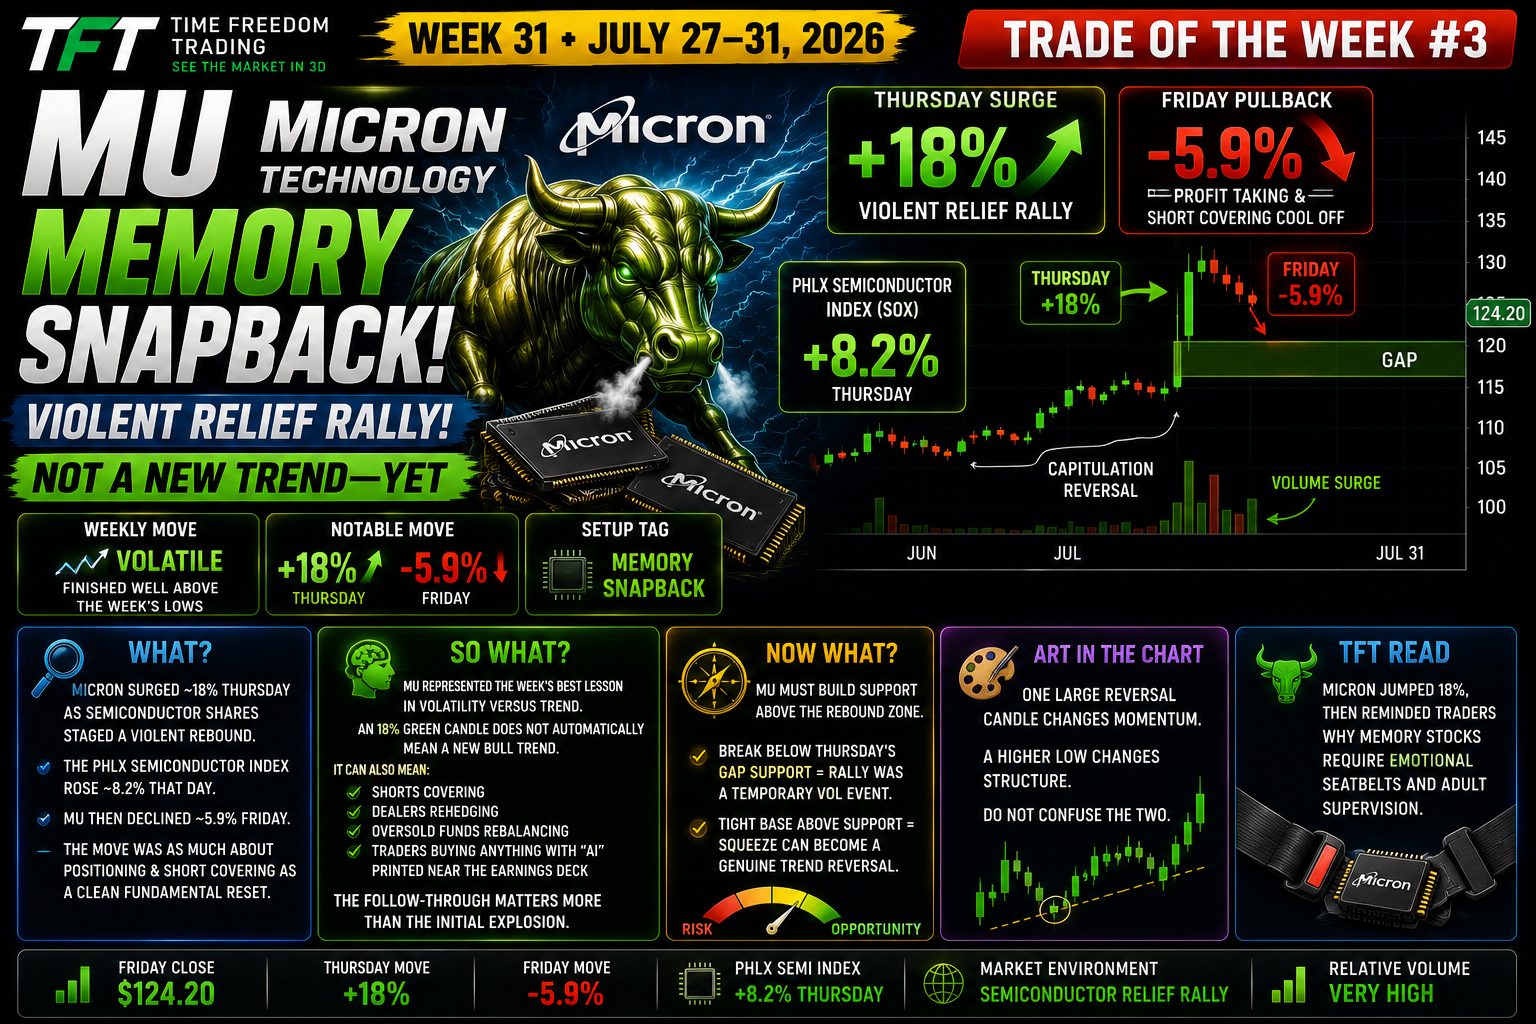
3. MU — Micron Technology
- Weekly move: Volatile; finished well above the week’s lows
- Notable move: Approximately +18% Thursday, followed by a 5.9% pullback
- Catalyst: Broad semiconductor relief rally following Microsoft’s AI-cloud results and a reversal in heavily sold memory names
- Chart pattern: Capitulation reversal and short-covering squeeze
- Move classification: Reversal
-
Setup tag: Memory Snapback
What?
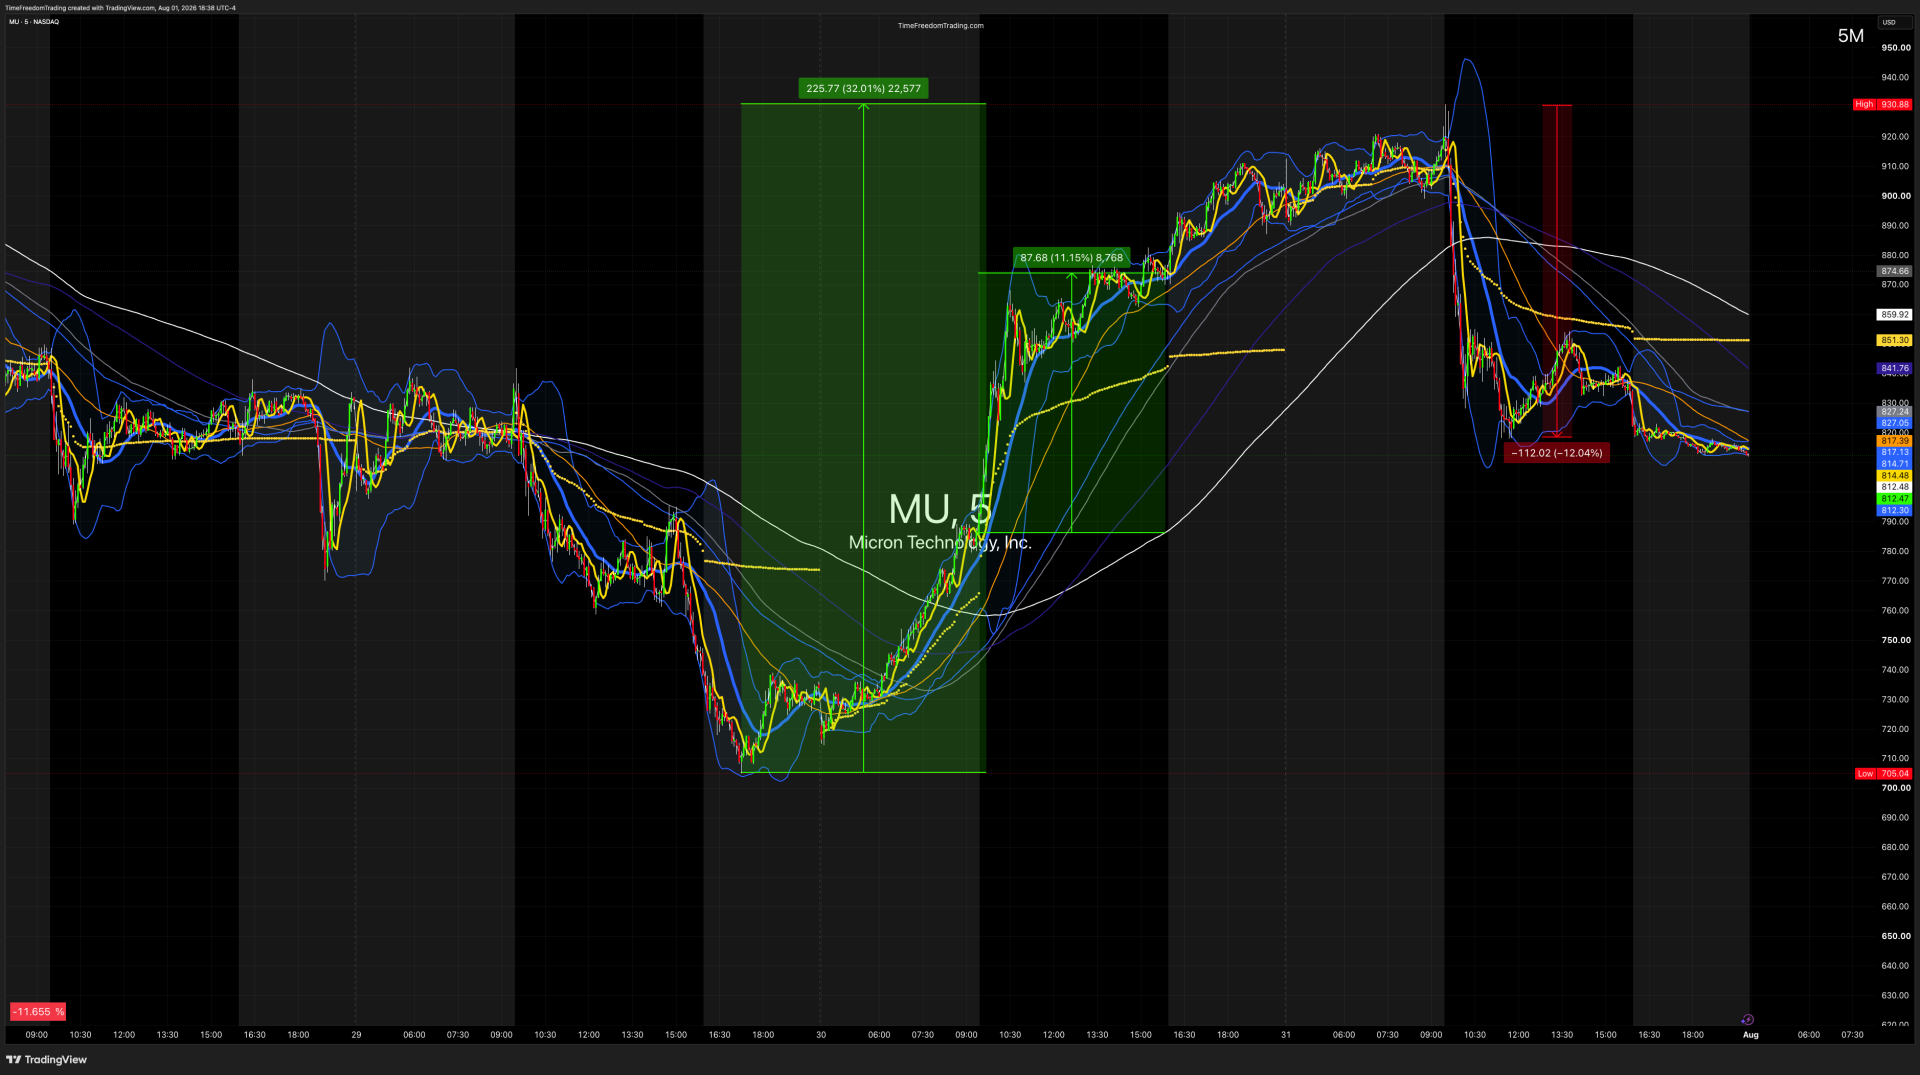
Micron surged approximately 18% Thursday as semiconductor shares staged a violent rebound. The PHLX Semiconductor Index rose approximately 8.2% that day, with investors moving back into AI and memory names following Microsoft’s cloud report.
Micron then declined approximately 5.9% Friday, demonstrating that the move was as much about positioning and short covering as it was about a clean fundamental reset.
So What?
MU represented the week’s best lesson in volatility versus trend.
An 18% green candle does not automatically mean a new bull trend.
It can also mean:
- Shorts covering
- Dealers rehedging
- Oversold funds rebalancing
- Traders buying anything with the letters “AI” printed near the earnings deck
The follow-through matters more than the initial explosion.
Now What?
MU must build support above the rebound zone.
A break below Thursday’s gap support would expose the rally as a temporary volatility event.
A tight base above support could convert the squeeze into a genuine trend reversal.
Art in the Chart
One large reversal candle changes momentum.
A higher low changes structure.
Do not confuse the two.
TFT Read
Micron jumped 18%, then reminded traders why memory stocks require emotional seatbelts and adult supervision.
| Metric | Value |
|---|---|
| Direction | 🟢 Relief Rally |
| Friday Close | Pulled Back after Thursday Surge |
| Thursday Move | +18% |
| Friday Move | −5.9% |
| Approx. Two-Day Move | ≈ +11% |
| Primary Catalyst | Semiconductor Relief Rally |
| Trade Setup | Oversold Reversal |
| Ideal Entry | First higher low after earnings relief rally |
| Confirmation | Holds VWAP and Thursday midpoint |
| Ideal Strategy | Bull Call Spread |
| Invalidation | Break below Thursday low |
| Market Environment | Semiconductor Short Covering |
| Relative Volume (RVOL) | Very High |
| Institutional Read | Short Covering + Early Buying |
| Trade Grade | ⭐⭐⭐⭐☆ (A-) |
| 1K WAY™ Setup | Memory Snapback |
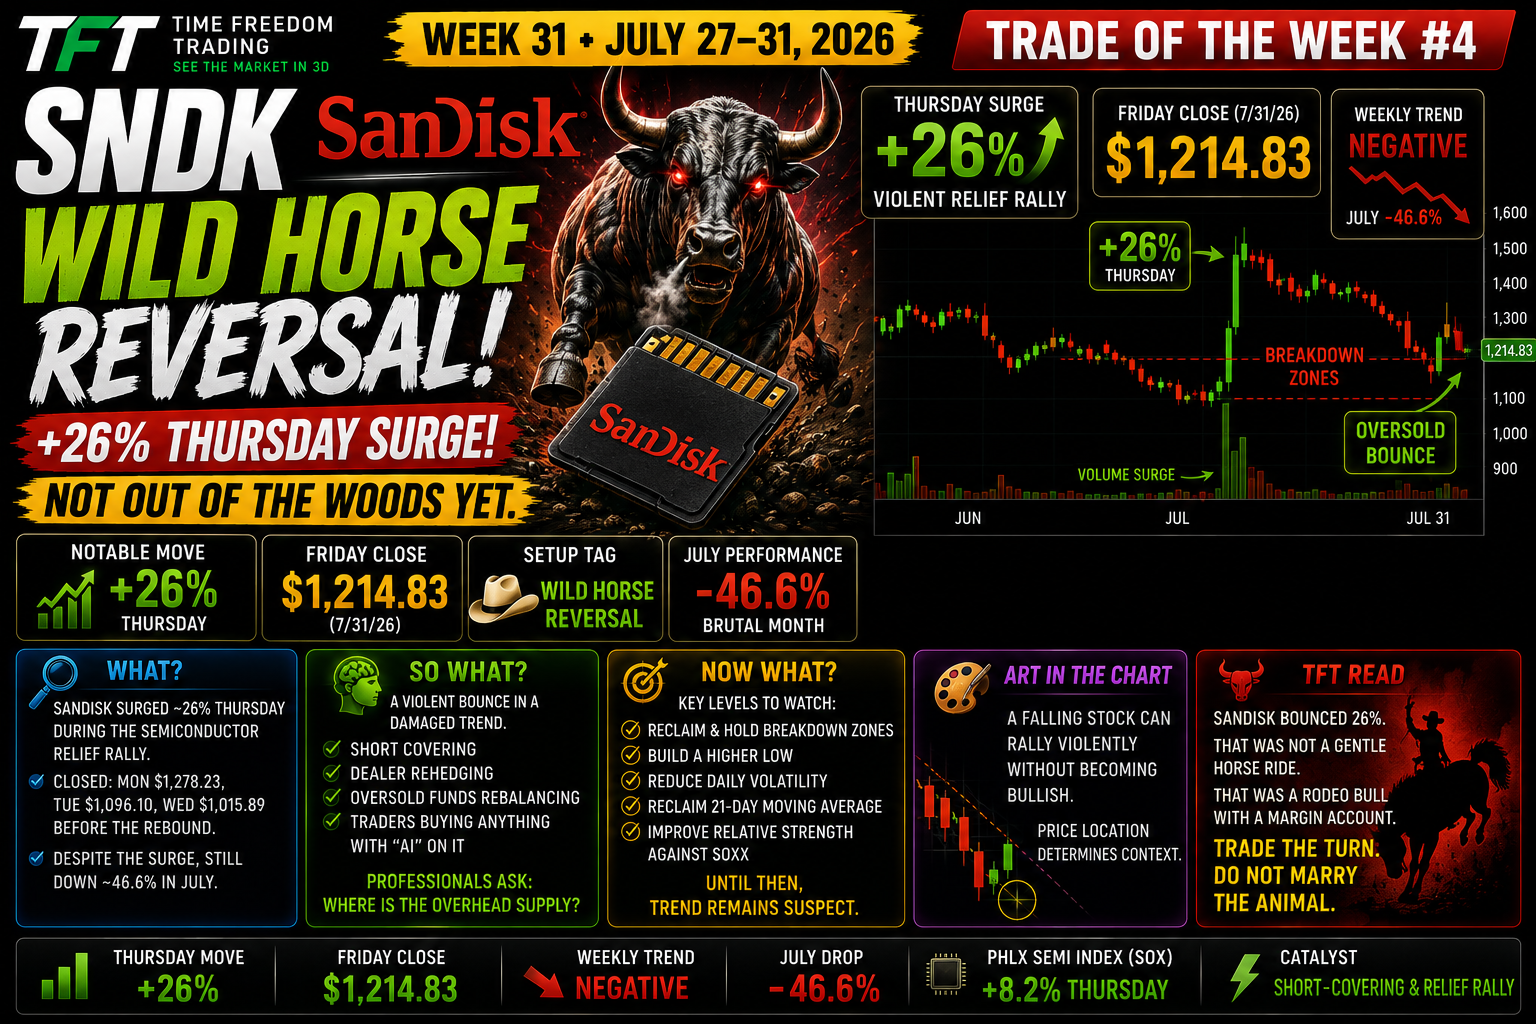
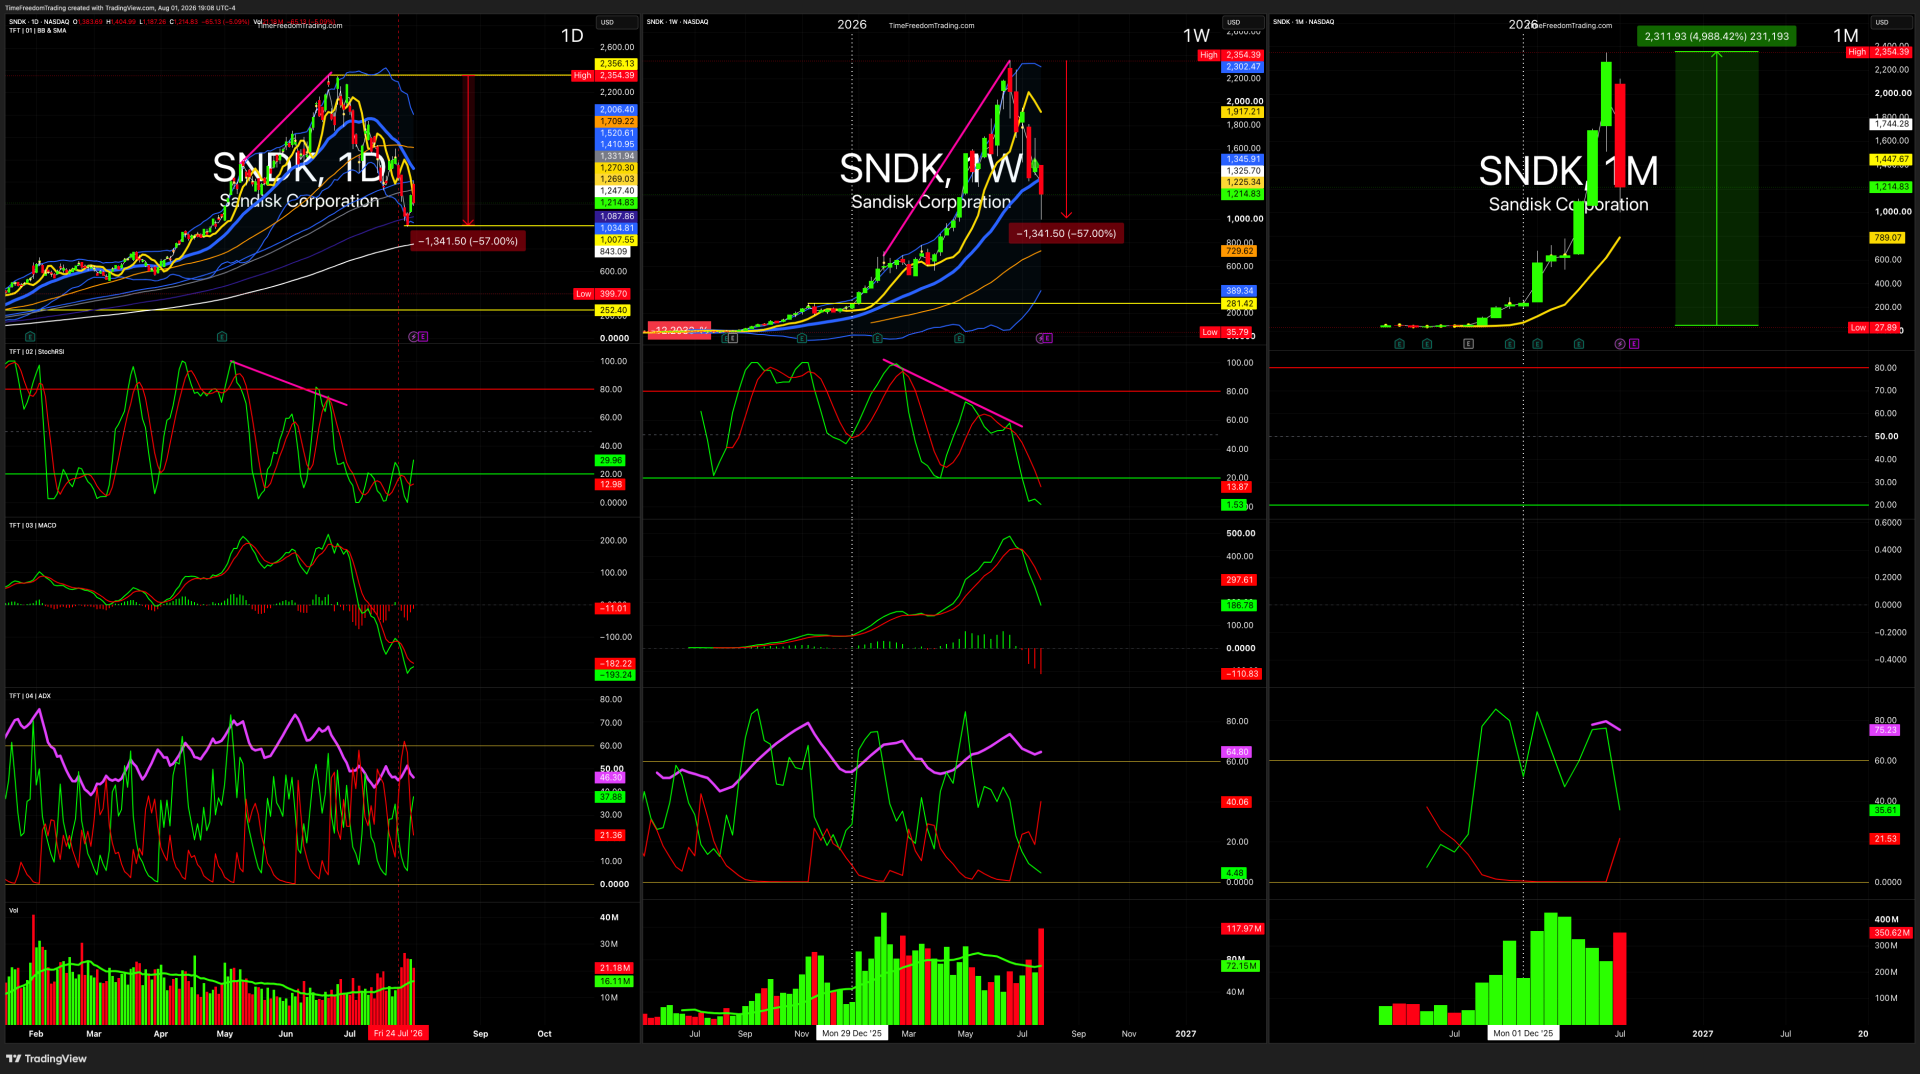
4. SNDK — SanDisk
- Weekly move: Negative overall despite a historic Thursday rebound
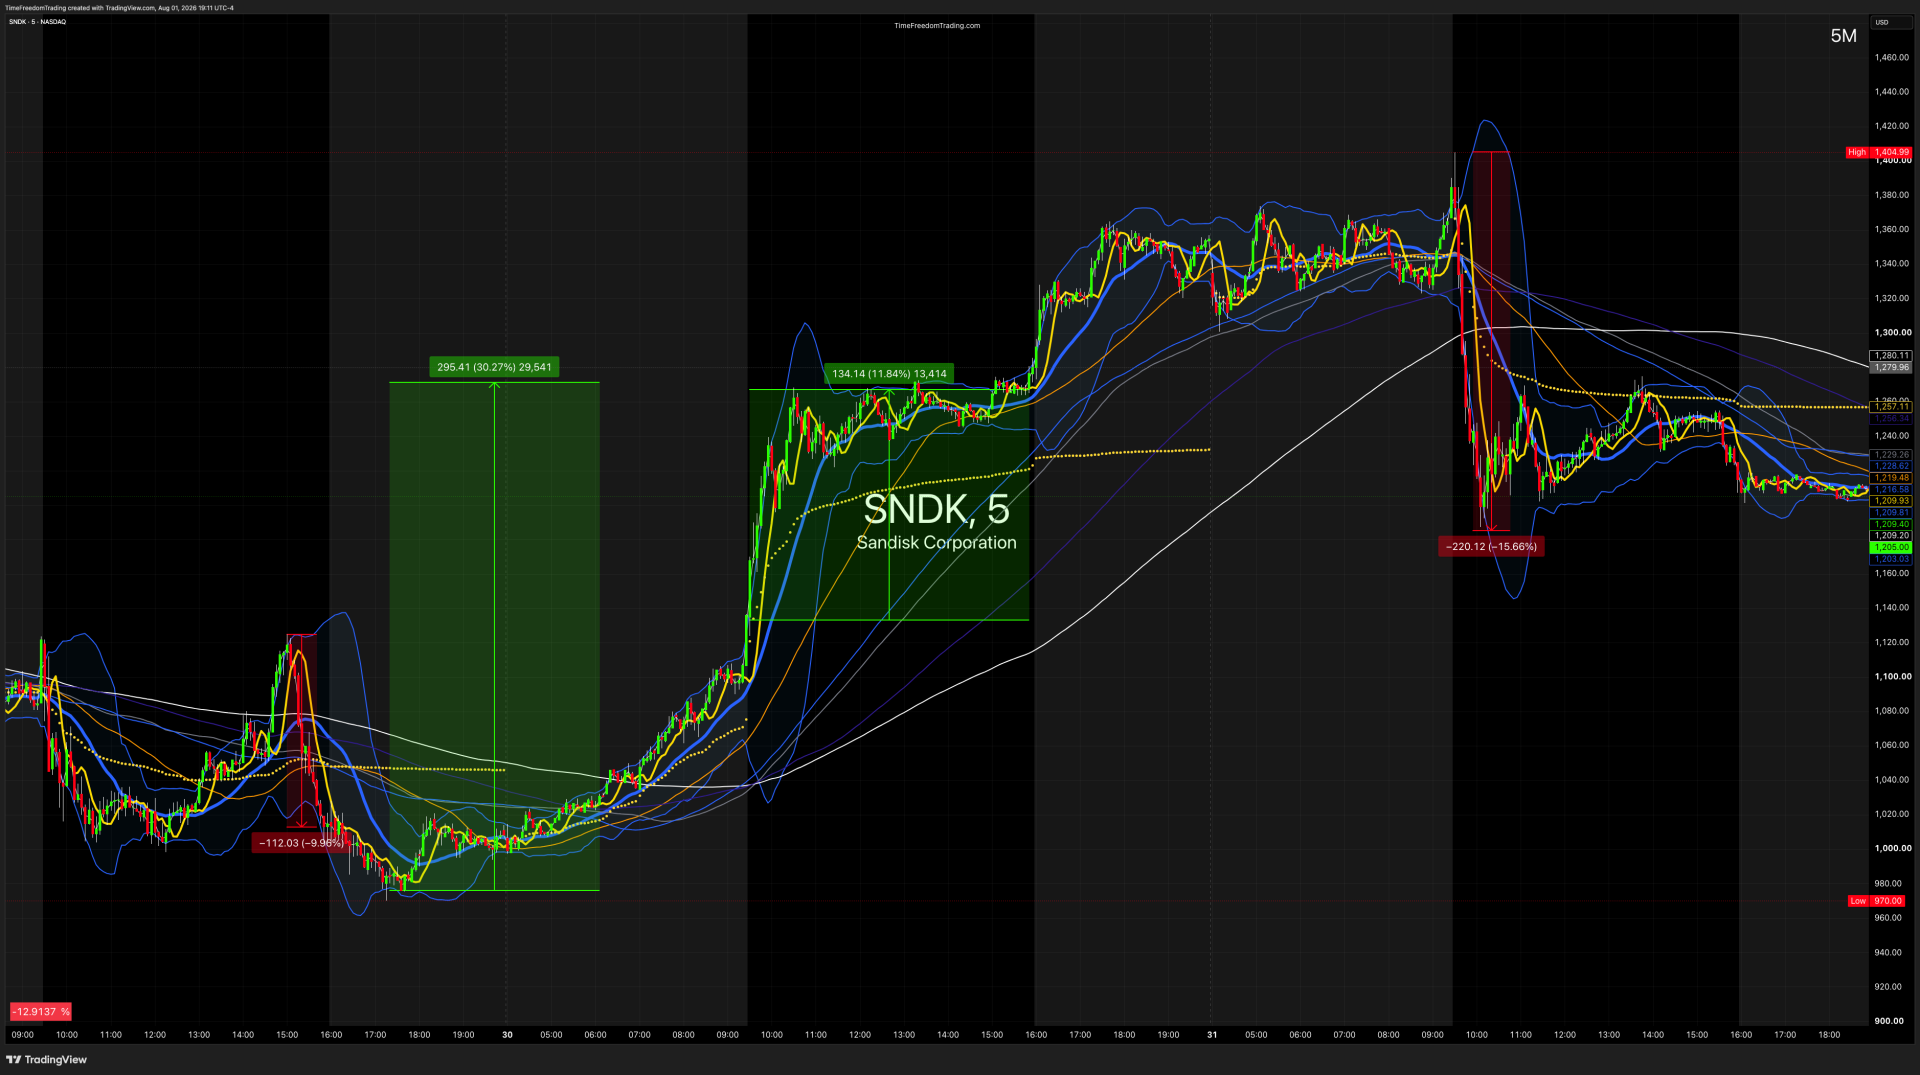
- Notable move: Approximately +26% Thursday
- Friday close: Reported near $1,214.83
- Catalyst: Short-covering and relief rally across battered memory and semiconductor stocks
- Chart pattern: Oversold bear-market bounce
- Move classification: Reversal attempt
-
Setup tag: Wild Horse Reversal
What?
SanDisk surged approximately 26% Thursday during the semiconductor relief rally, after suffering sharp declines earlier in the week and throughout July.
Historical data show SNDK closed at $1,278.23 Monday, $1,096.10 Tuesday and $1,015.89 Wednesday before the Thursday rebound. The stock nevertheless remained deeply damaged after falling approximately 46.6% during July.
So What?
SanDisk was not a clean weekly winner.
It was one of the week’s most important trades because it demonstrated the Wild Horse Effect:
The more violently a stock becomes stretched from equilibrium, the more violent the snapback can become.
But a violent bounce inside a damaged trend is still a damaged trend.
Amateurs see +26% and yell:
“New bull market!”
Professionals ask:
“Where is the overhead supply?”
Now What?
The key question is whether SNDK can reclaim and hold the breakdown zones created earlier in the week.
Until that happens, the primary trend remains suspect.
The safer setup comes from:
- A higher low
- Reduced daily volatility
- A reclaim of the 21-day moving average
-
Improving relative strength against SOXX
Art in the Chart
A falling stock can rally violently without becoming bullish.
Price location determines context.
TFT Read
SanDisk bounced 26%.
That was not a gentle horse ride.
That was a rodeo bull with a margin account.
Trade the turn.
Do not marry the animal.
| Metric | Value |
|---|---|
| Direction | 🟢 Relief Rally |
| Friday Close | ≈ $1,214.83 |
| Thursday Move | +26% |
| Weekly Trend | Still Bearish |
| Approx. July Performance | −46.6% |
| Primary Catalyst | Memory Stock Short Covering |
| Trade Setup | Wild Horse Reversal |
| Ideal Entry | Pullback after reversal candle |
| Confirmation | Higher low with improving breadth |
| Ideal Strategy | Bull Call Spread (defined risk) |
| Invalidation | Loss of Thursday low |
| Market Environment | Oversold Semiconductor Bounce |
| Relative Volume (RVOL) | Extremely High |
| Institutional Read | Short Covering—not Full Accumulation |
| Trade Grade | ⭐⭐⭐⭐☆ (A-) |
| 1K WAY™ Setup | Wild Horse Effect |
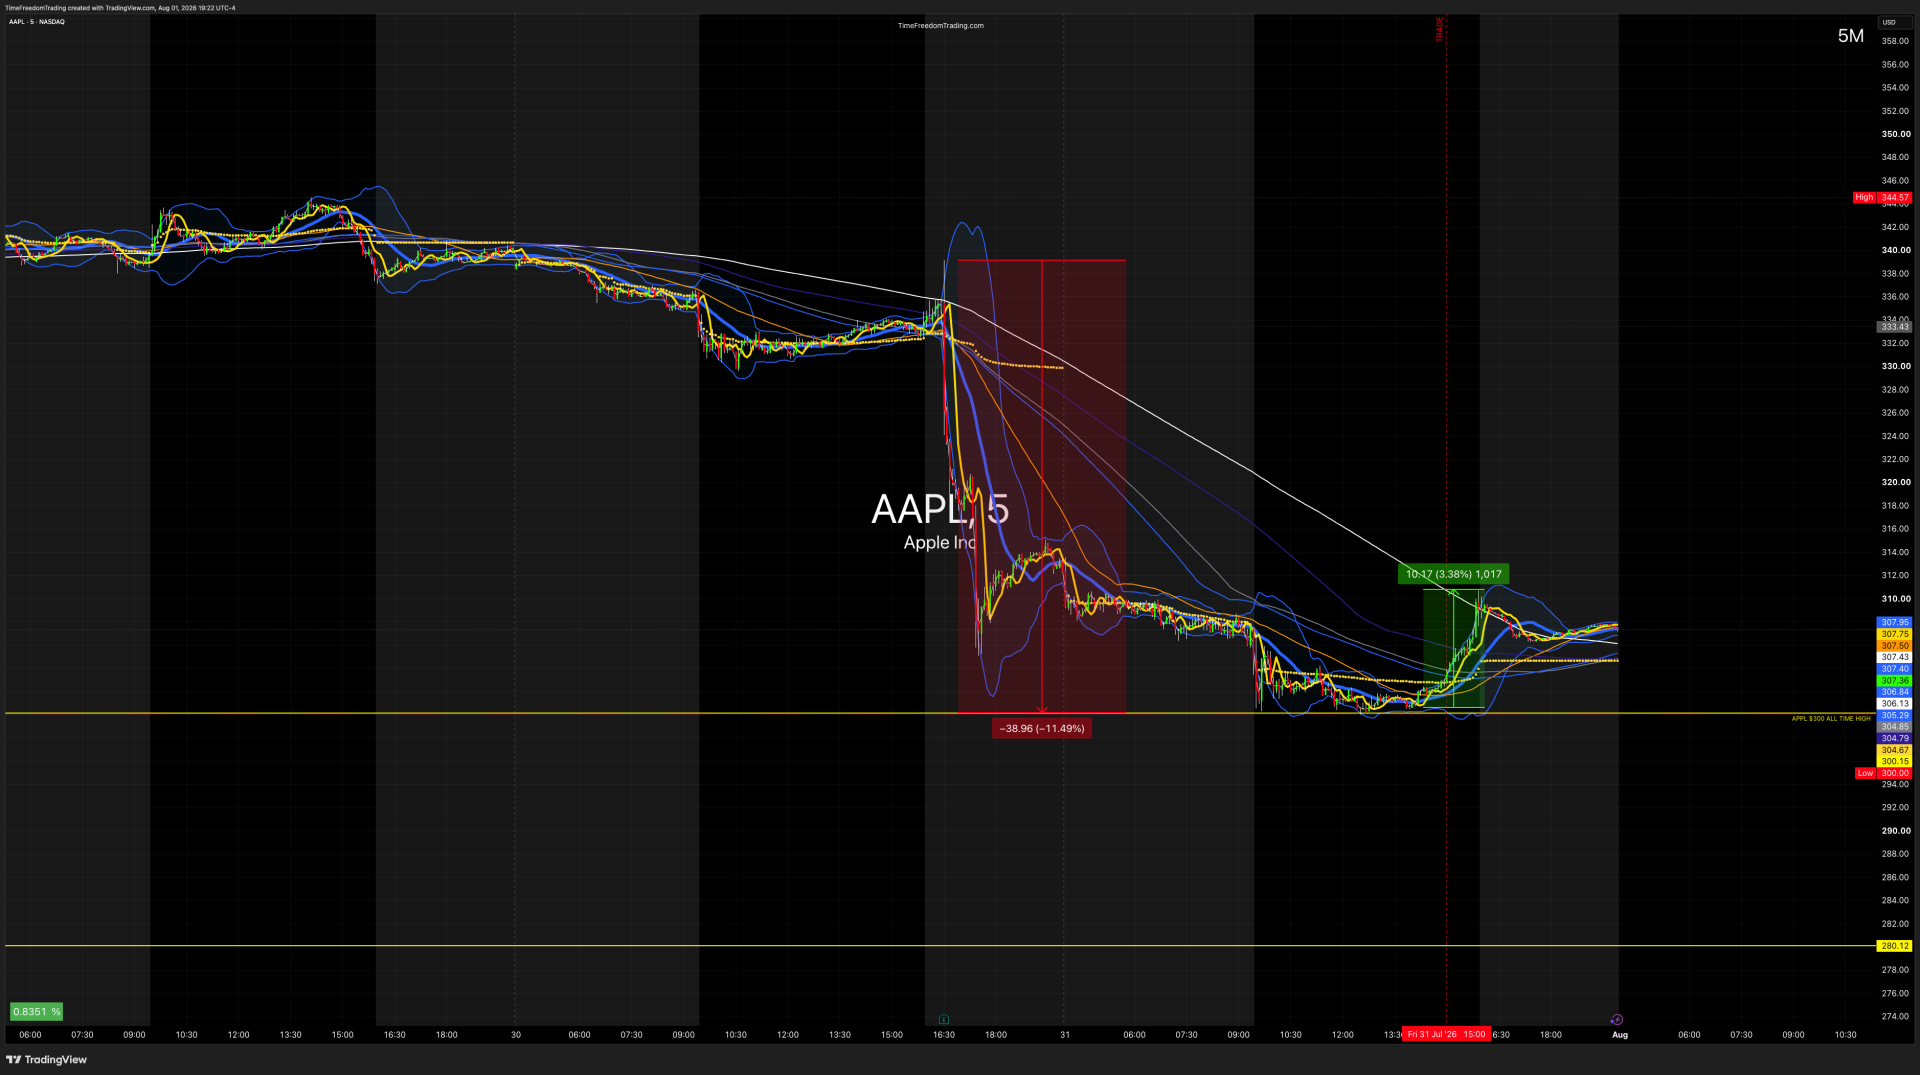
5. AAPL — Apple
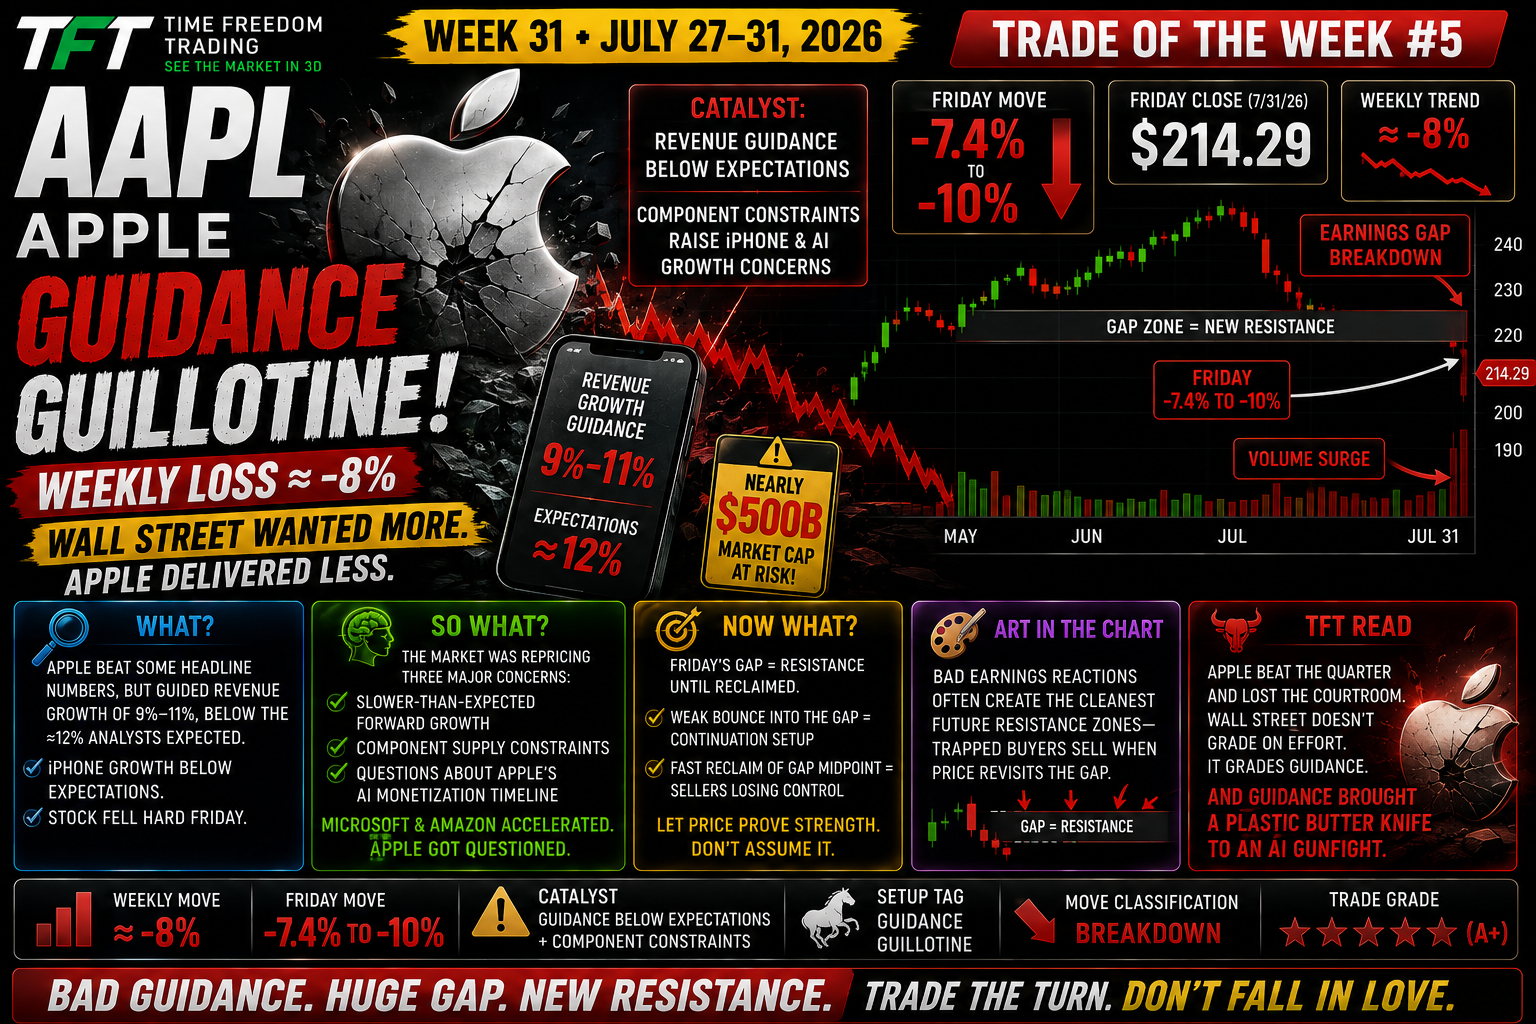
- Weekly move: Approximately –8%
- Friday move: Approximately –7.4% to –10%
- Catalyst: Revenue guidance fell below Wall Street’s expectations, while component constraints raised concerns about iPhone growth and AI-era execution.
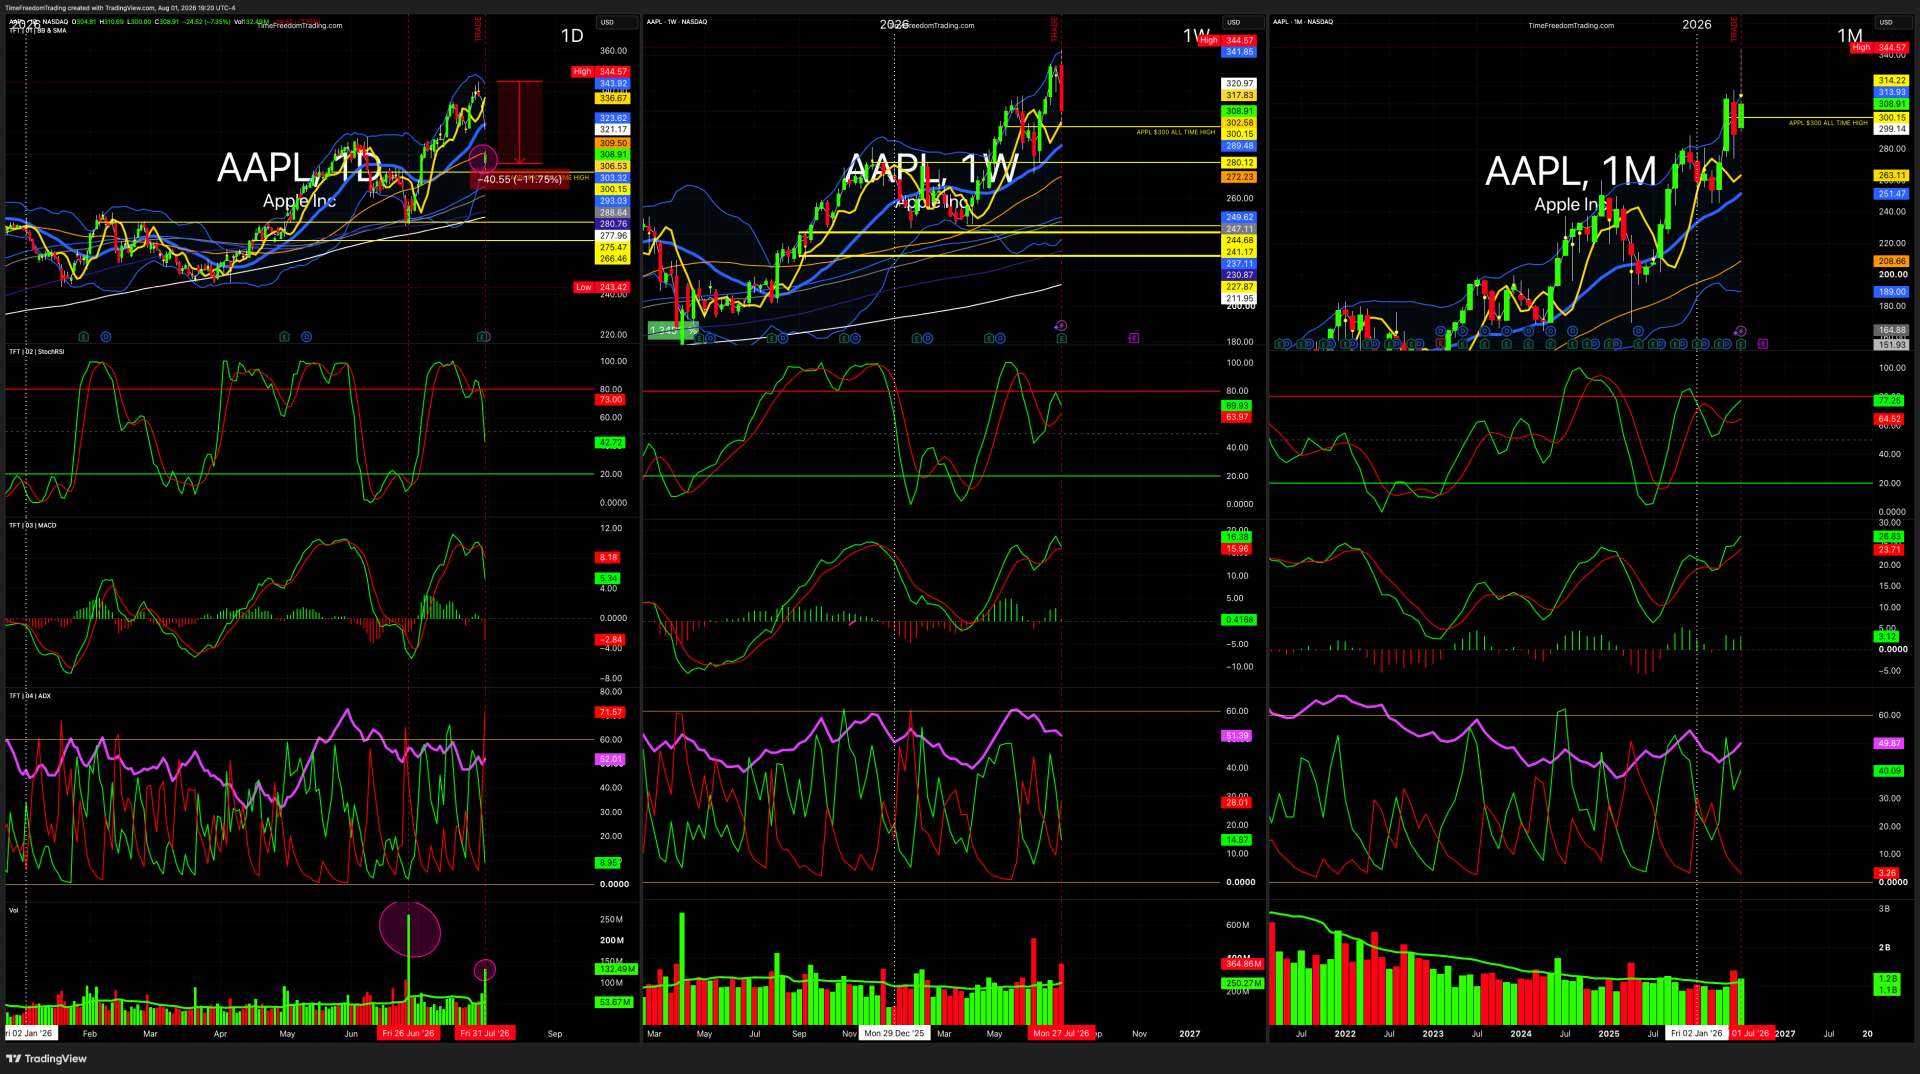
- Chart pattern: Earnings gap breakdown
- Move classification: Breakdown
-
Setup tag: Guidance Guillotine
What?
Apple’s quarterly results beat some headline expectations, but management forecast revenue growth of approximately 9% to 11%, below the roughly 12% expected by analysts. Management also projected iPhone growth below consensus expectations.
The stock fell sharply Friday, with reports placing the decline between approximately 7.4% and 10%. Reuters estimated Apple was positioned to lose nearly $500 billion in market value during the selloff.
So What?
Apple delivered the week’s cleanest downside catalyst.
The market was not simply reacting to one quarter.
It was repricing three concerns:
- Slower-than-expected forward growth
- Component supply constraints
- Questions about Apple’s AI monetization timeline
Microsoft and Amazon showed accelerating cloud growth.
Apple showed a hardware ecosystem confronting supply constraints while Wall Street demanded clearer AI returns.
Now What?
Friday’s gap becomes resistance until reclaimed.
A weak bounce into the gap could create a continuation setup.
A fast reclaim of the gap midpoint would warn that sellers are losing control.
Art in the Chart
Bad earnings reactions often create the cleanest future resistance zones because trapped buyers sell when price revisits the gap.
TFT Read
Apple beat the quarter and lost the courtroom.
Wall Street does not grade on effort.
It grades guidance.
And guidance brought a plastic butter knife to an AI gunfight.
| Metric | Value |
|---|---|
| Direction | 🔴 Bearish |
| Friday Close | Post-Earnings Breakdown |
| Friday Earnings Move | −7.4% |
| Market Cap Lost | ≈ $400–500 Billion |
| Primary Catalyst | Weak Forward Guidance + Supply Constraints |
| Trade Setup | Earnings Gap Breakdown |
| Ideal Entry | Failed rally into earnings gap resistance |
| Confirmation | Loss of VWAP after failed opening bounce |
| Ideal Strategy | Defined-Risk Long Puts |
| Invalidation | Gap reclaim above Friday high |
| Market Environment | Mega-Cap Technology Distribution |
| Relative Volume (RVOL) | Extremely High |
| Institutional Read | Distribution |
| Trade Grade | ⭐⭐⭐⭐⭐ (A+) |
| 1K WAY™ Setup | Guidance Guillotine |
STOCK MARKET LESSON of the WEEK
EARNINGS DO NOT MOVE STOCKS—EXPECTATION GAPS DO.
Apple beat portions of its reported quarter and fell sharply.
Microsoft beat expectations and exploded.
Amazon beat expectations and exploded.
The difference was not simply whether each company reported “good” numbers.
The difference was the gap between:
- What investors expected
- What management delivered
- What management projected next
That is why trading earnings based only on “beat or miss” is financial roulette with better graphics.
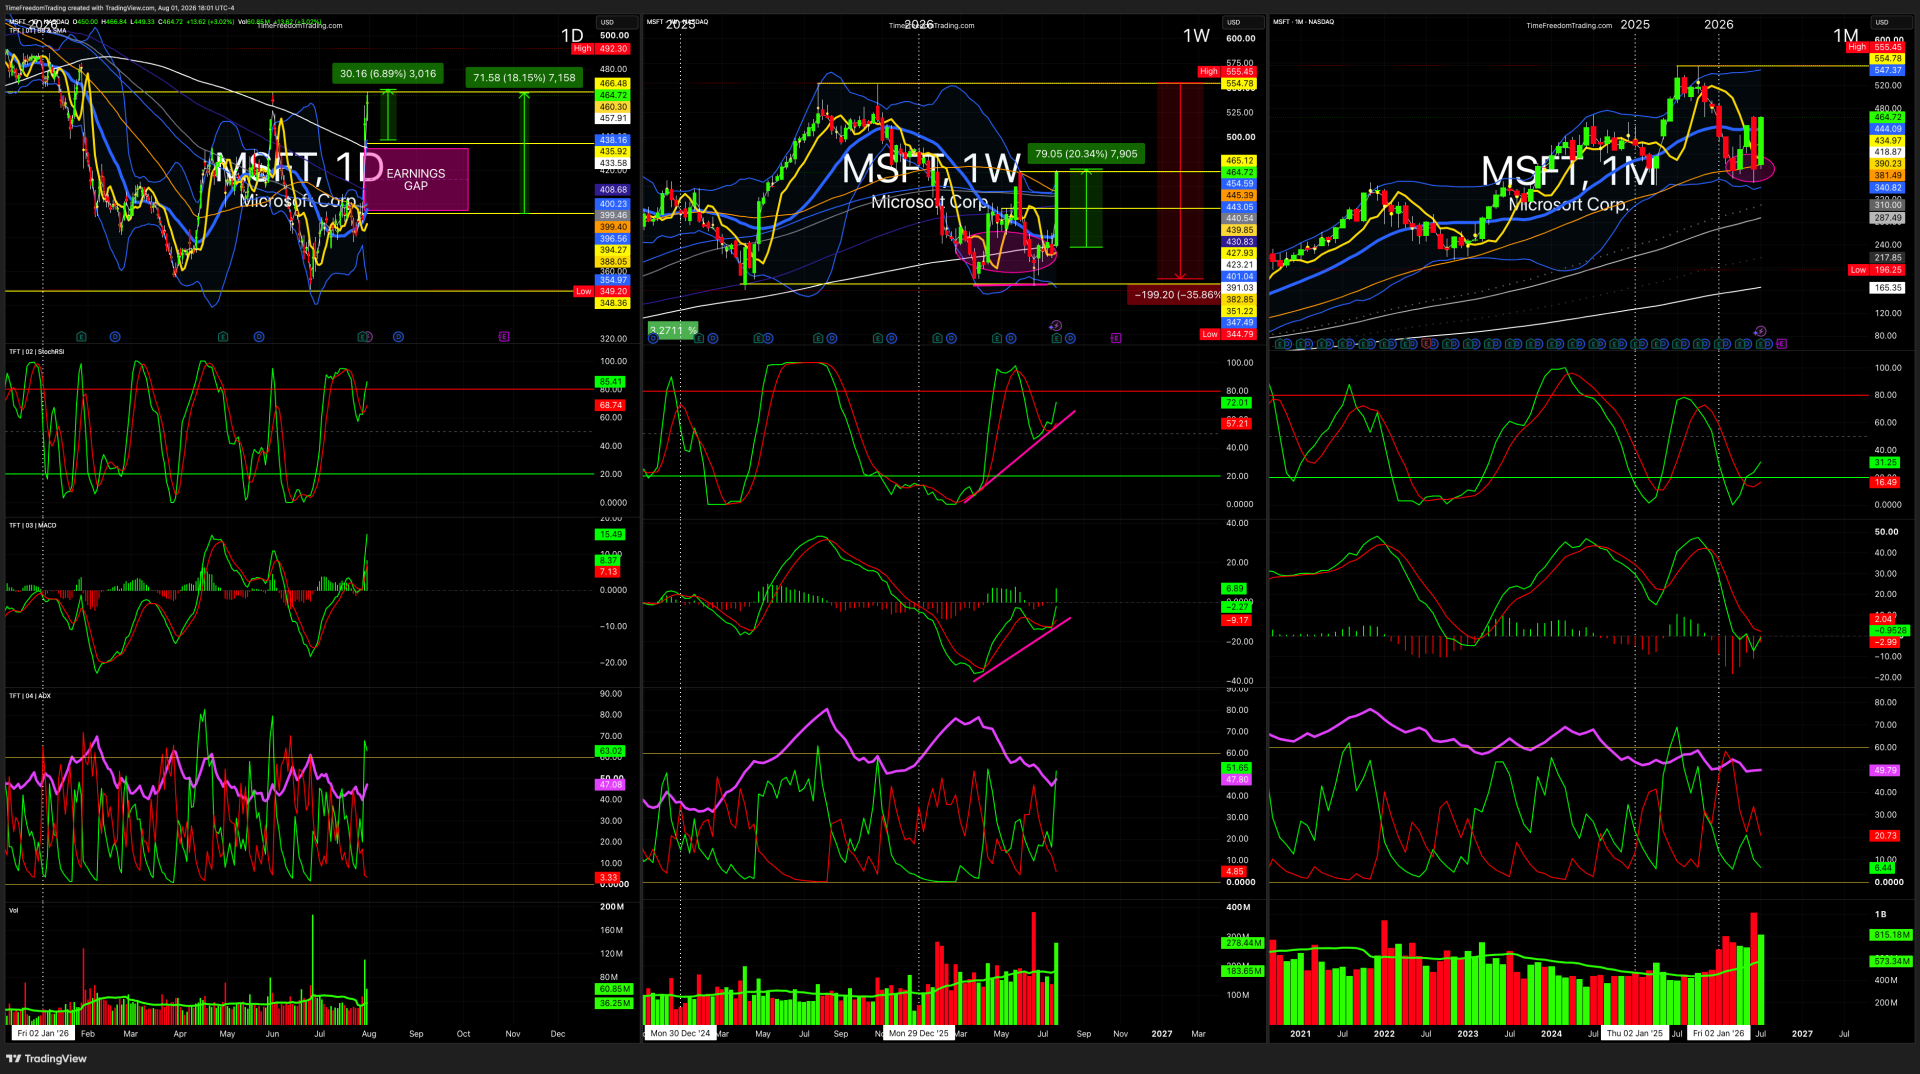
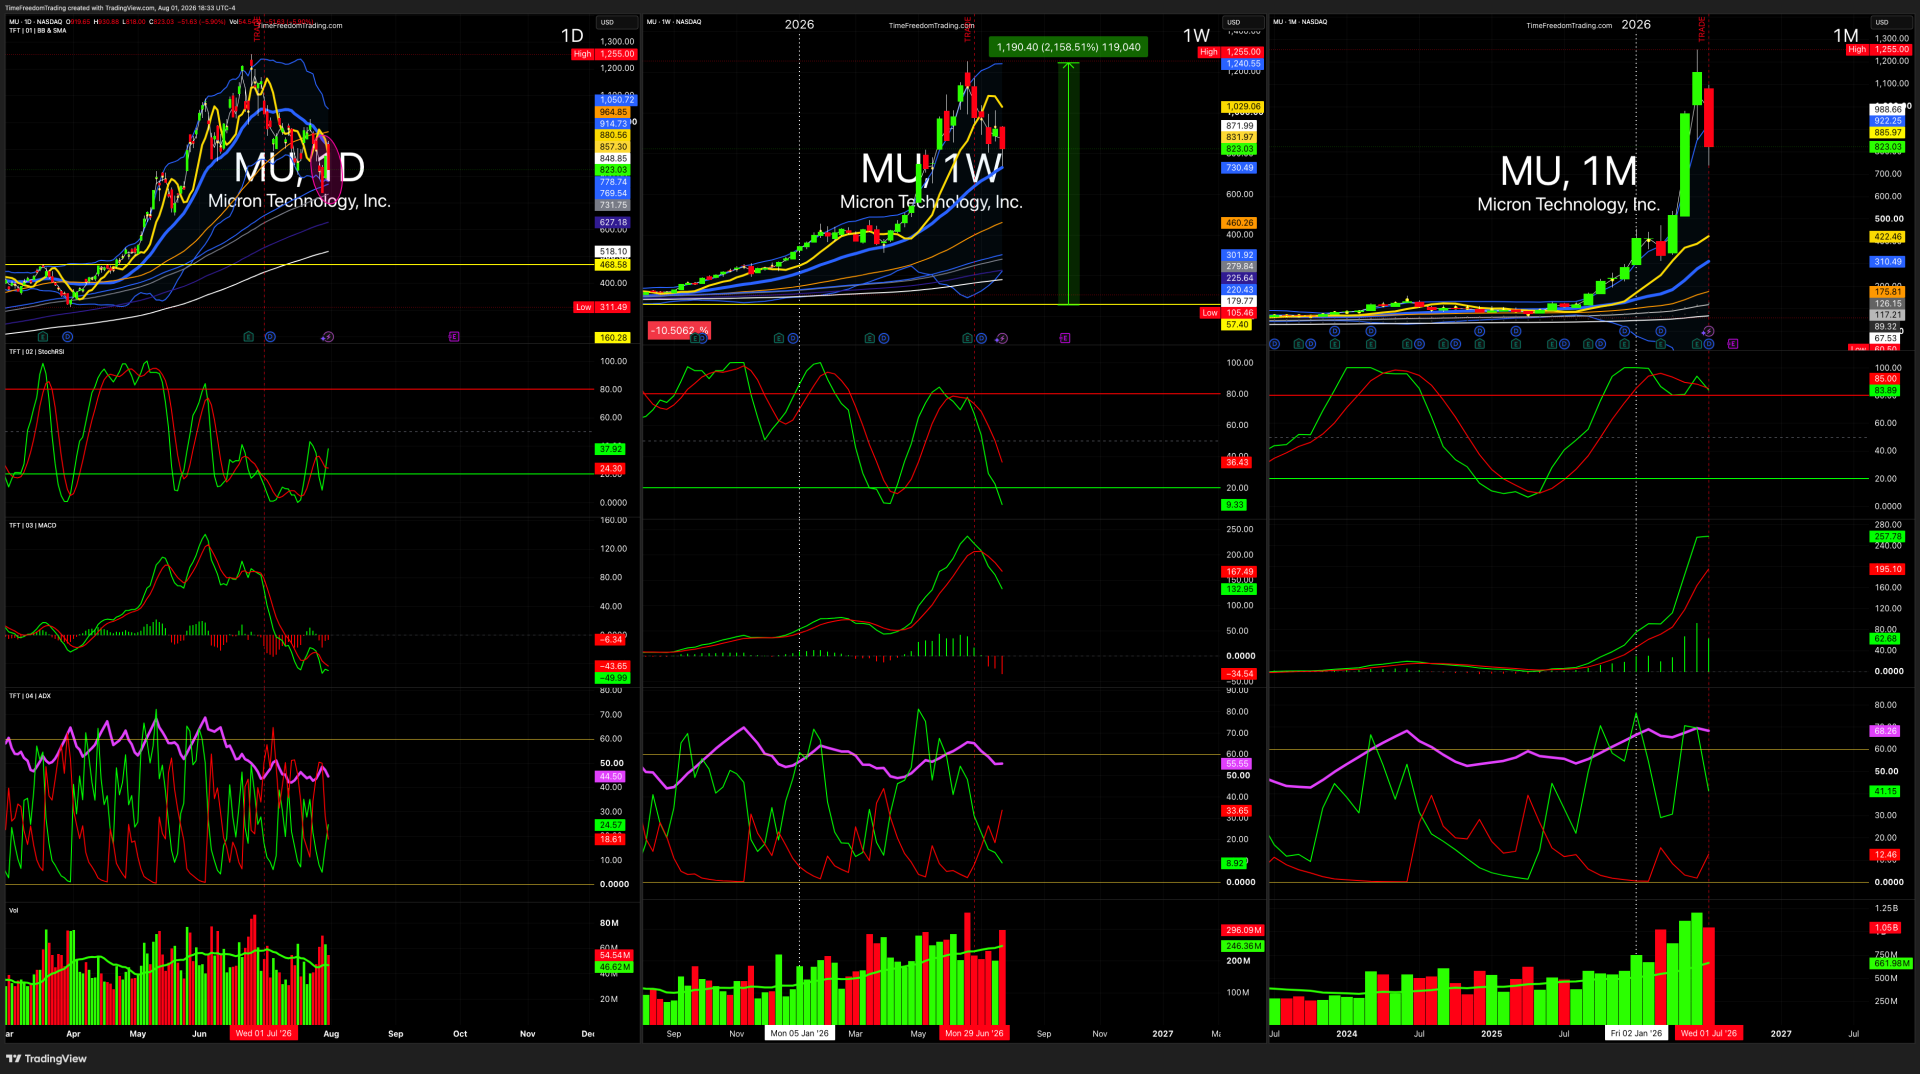
Daily Chart
Use the earnings gap to define the immediate battlefield.
Mark:
- Gap high
- Gap low
- Gap midpoint
- Prior closing price
-
First-hour range
Weekly Chart
Determine whether the earnings move confirms or breaks the established weekly trend.
A bullish daily gap inside a damaged weekly chart may only be a squeeze.
Monthly Chart
Use the monthly trend to understand the institutional backdrop.
A stock can be bearish daily, damaged weekly and still structurally bullish monthly.
That is how you see the market in 3D.
The TFT Takeaway
The catalyst creates volatility.
The chart determines whether you have a trade.
Do not gamble through earnings because you hope management says the magic words.
Trade the pre-earnings IV rush.
Trade the post-earnings reaction.
Trade the gap structure.
Let someone else donate tuition to the IV-crush university.
WEEK 32 : THE WEEK AHEAD
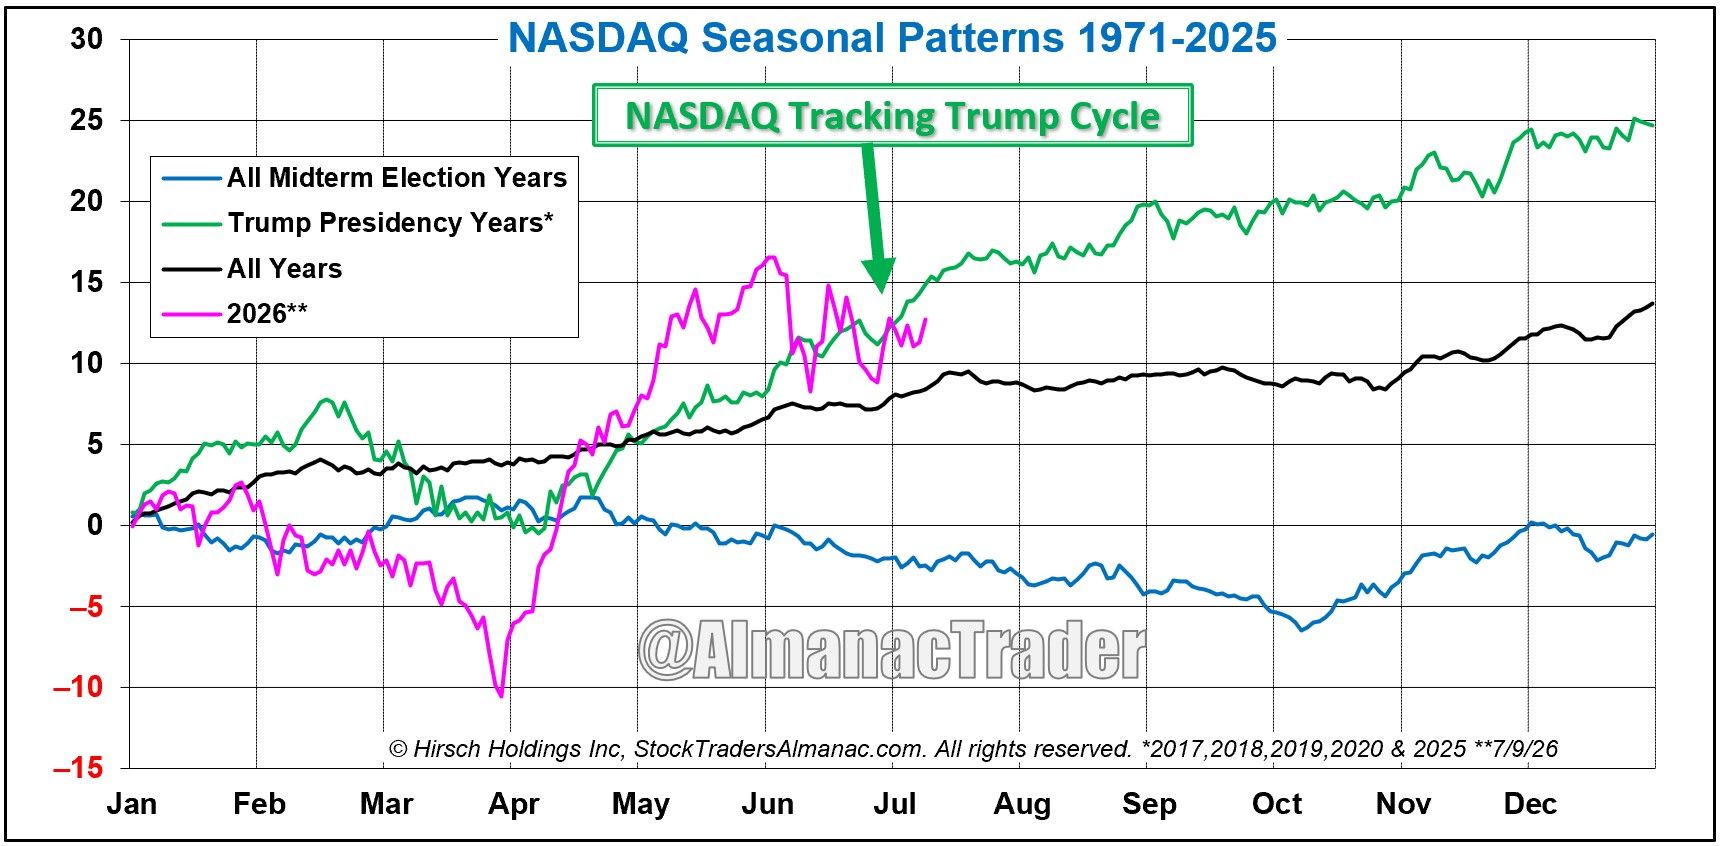
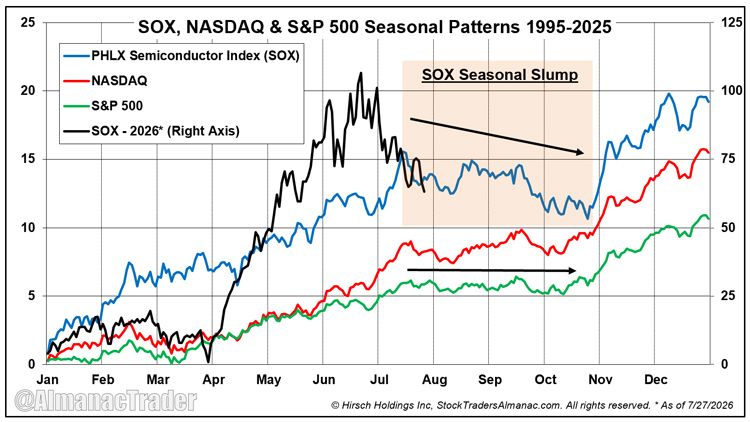

Week 32 Outlook
Aug 3rd–7th, 2026
Strength
The market demonstrated resilience under significant pressure.
Higher Treasury yields, elevated oil, a hawkish Federal Reserve and Apple’s post-earnings collapse were not enough to derail the indexes. Microsoft and Amazon restored confidence that the largest AI infrastructure investments can generate accelerating cloud revenue.
Leadership also broadened beyond one stock.
That matters.
A market dependent on a single hero is fragile.
A market capable of rotating between cloud, industrials, financials, energy and selected technology has more structural support.
Weakness
The semiconductor complex remains technically damaged.
Thursday’s rebound was powerful, but July’s decline was historic. SOXX reportedly fell more than 22% during the month, while several former leaders remained far beneath recent highs.
Long-term Treasury yields also remain a growing problem.
If earnings estimates stall while discount rates rise, valuations will eventually meet mathematics.
And mathematics rarely accepts motivational speeches.
Opportunity
The best opportunity is developing in the separation between AI builders, AI beneficiaries and AI storytellers.
Companies showing measurable cloud acceleration, backlog growth, margin expansion and cash generation should command premium attention.
The secondary opportunity lies in oversold semiconductor and memory names—but only after price confirms that the selling structure has changed.
The game is not to buy the cheapest chart.
The game is to identify when institutional demand returns.
Threat
The largest threat remains the combination of:
- Elevated oil
- Rising long-term yields
- Persistent inflation
- Hawkish monetary policy
-
Excessive technology valuations
Any renewed geopolitical escalation could push oil higher and make the Federal Reserve’s inflation problem more difficult.
The second threat is earnings asymmetry.
When expectations become extreme, a company can beat current estimates and still collapse because guidance fails to satisfy the fantasy.
Apple just provided the $400-billion tutorial.
“Everyone gets what
they want out of the market.”
— Ed Seykota
“Earnings are an opinion;
cash flow is a fact.”
| Alfred Rappaport
TFT WEEK-AHEAD BATTLE PLAN
Trade the reaction—not the expectation.
The market enters the week with:
- Strong cloud earnings
- Damaged semiconductor charts
- Elevated Treasury yields
- Labor-market uncertainty
- Heavy single-stock earnings risk
That combination favors tactical trading over blind index conviction.
JOBS WEEK MEETS EARNINGS ROULETTE
The market survived the Fed.
It survived Apple’s guidance face-plant.
It survived one of the most violent semiconductor months in decades.
Now Wall Street must answer a more dangerous question:
Is the economy still strong enough to support earnings without keeping inflation—and interest rates—too high?
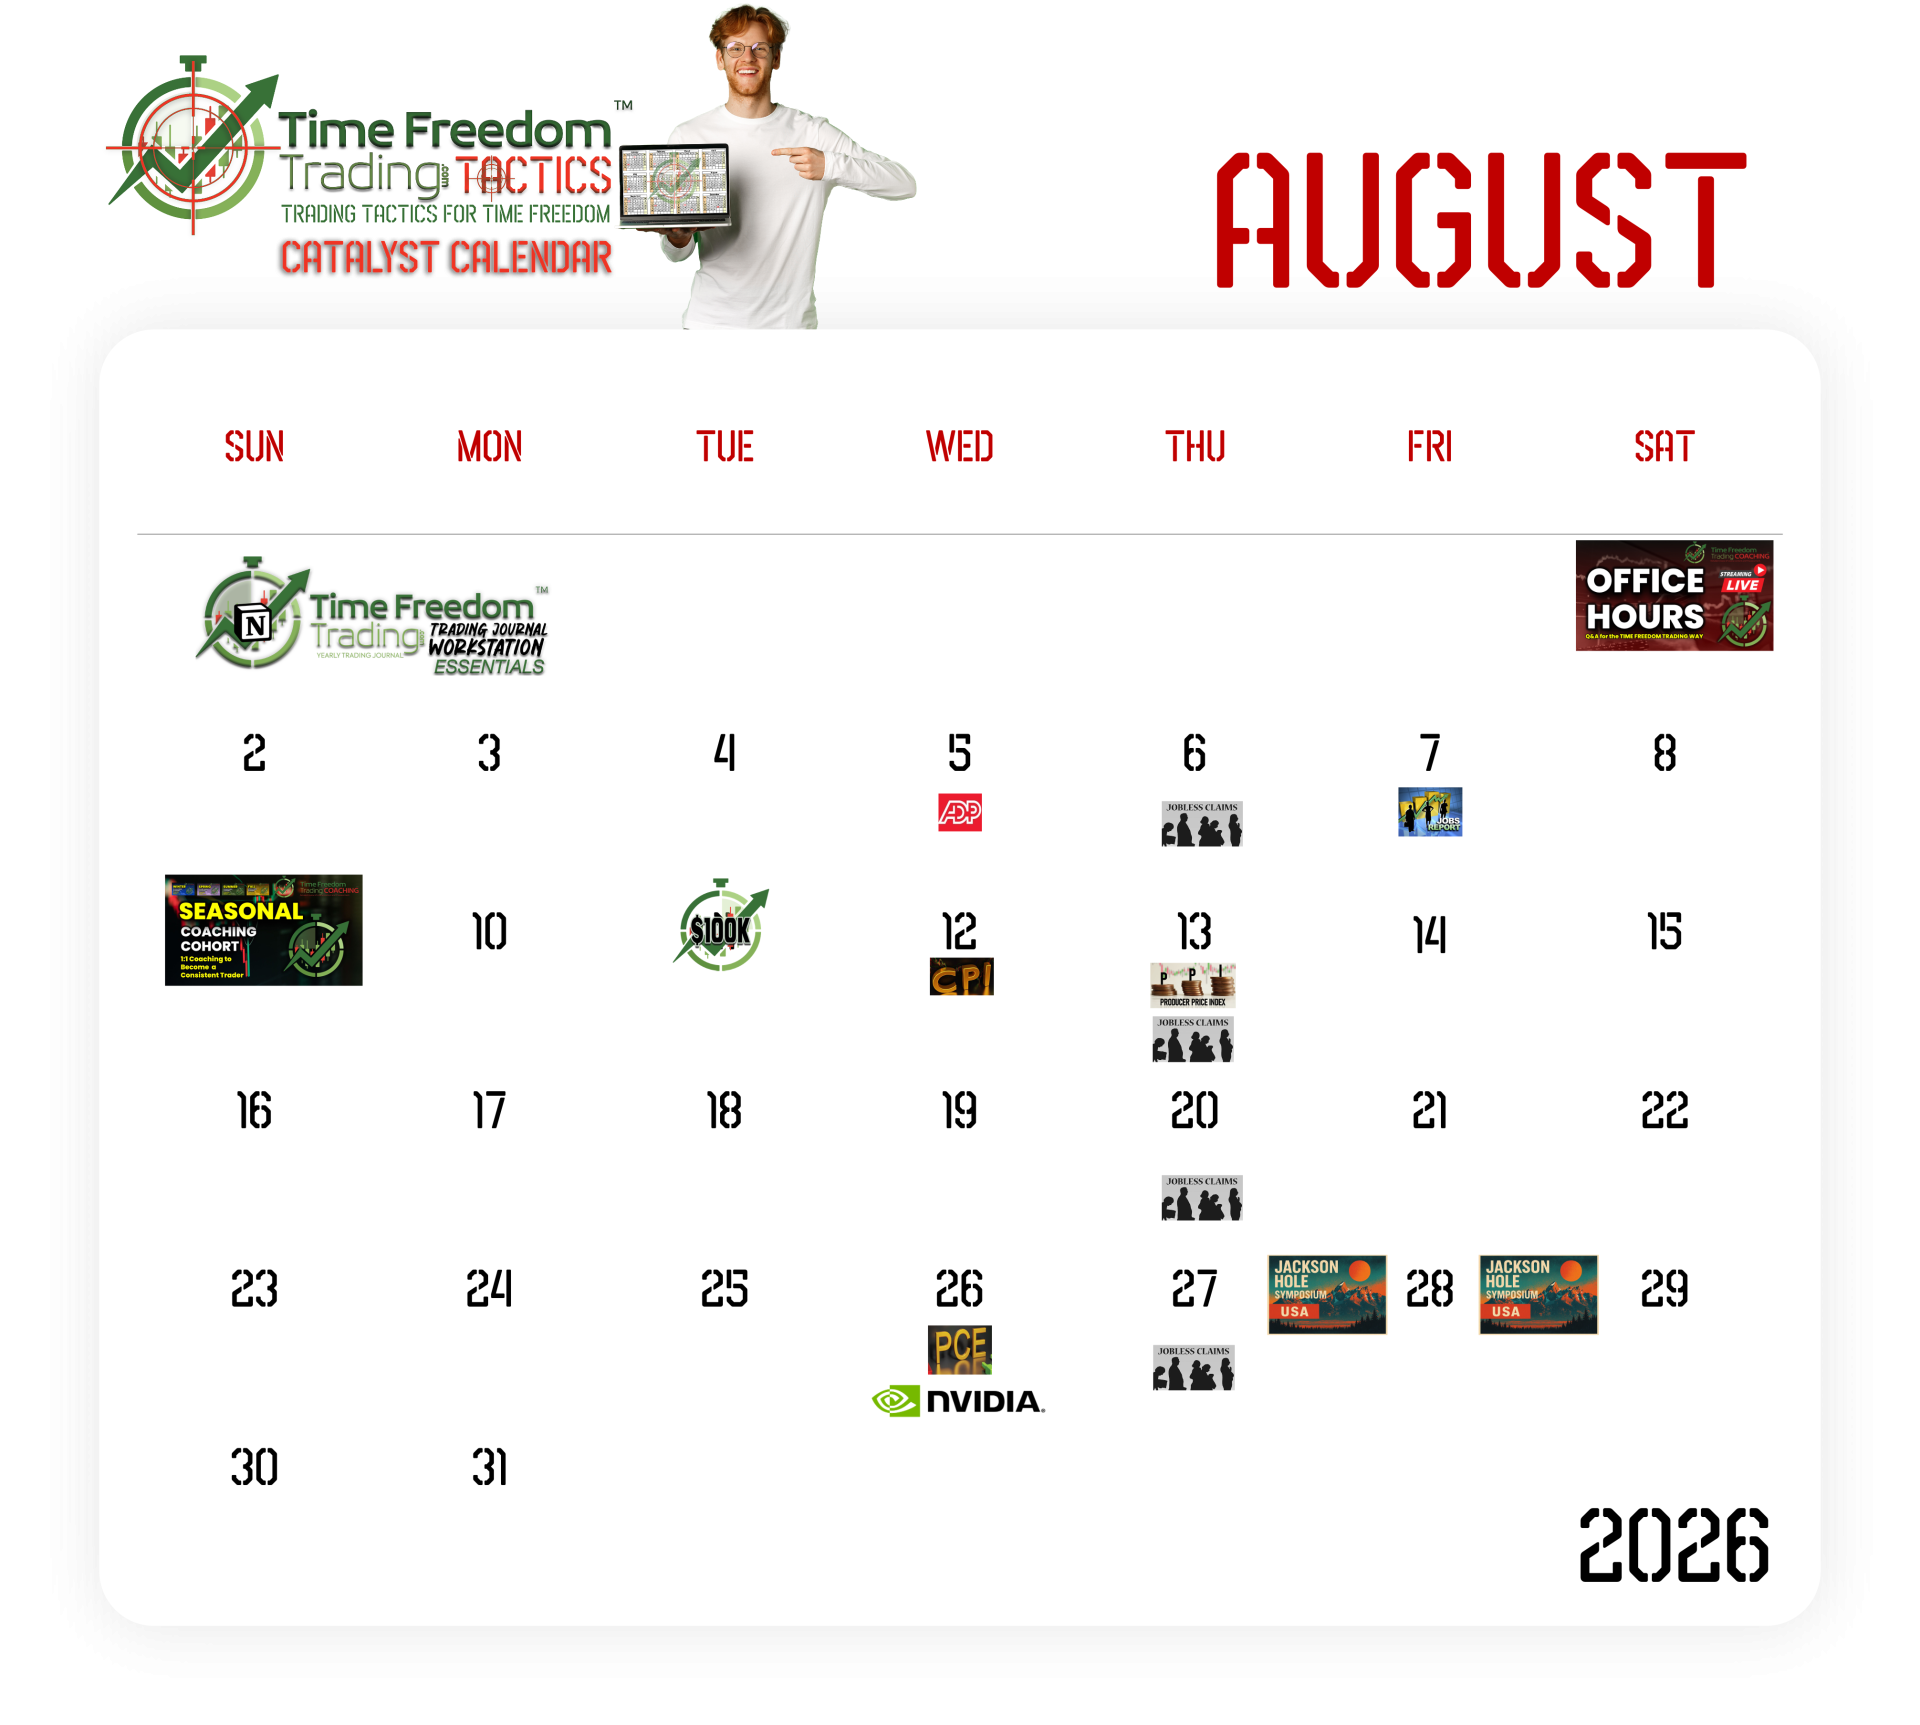
The week of August 3–7 brings a concentrated mix of:
- Manufacturing data
- Job openings
- Private payrolls
- Services activity
- Weekly jobless claims
- Productivity data
- The July employment report
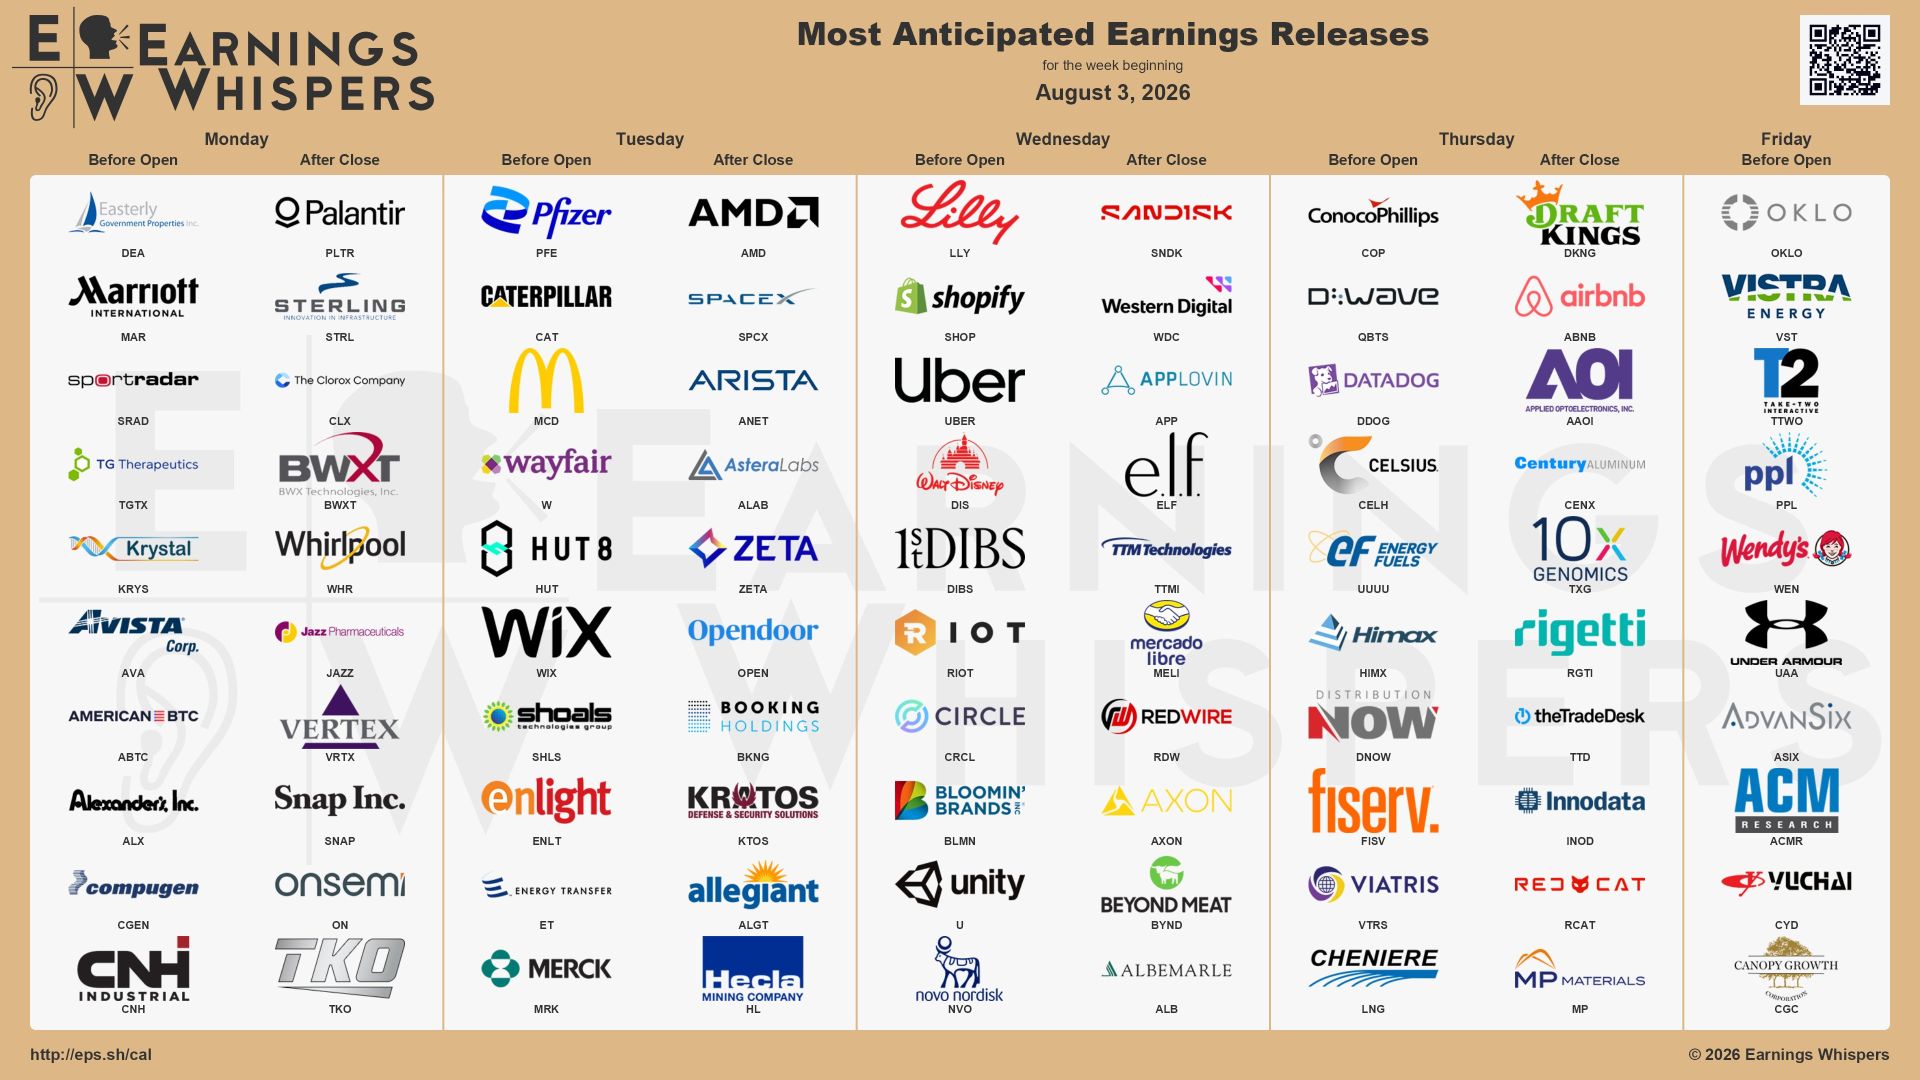
- Major AI, semiconductor, consumer and industrial earnings
Friday’s jobs report is the heavyweight event. MarketWatch lists a median forecast of 85,000 new jobs, following June’s reported 57,000, with unemployment expected to rise from 4.2% to 4.3%.
That creates the classic Wall Street contradiction:
A strong jobs number may support economic growth—but push yields higher.
A weak number may lower yields—but trigger recession fears.
Apparently, Wall Street ordered Goldilocks with free same-day delivery.
DAY-BY-DAY CATALYST CALENDAR
| Day / Date | Key Catalysts to Watch | TFT Tactical Read |
|---|---|---|
| Monday, August 3 | 9:45 AM: Final manufacturing PMI. 10:00 AM: ISM Manufacturing. 10:00 AM: Construction Spending. July auto sales. Earnings: MAR, TSN, CLX, PLTR, ON, BWXT, STRL | Manufacturing determines whether the economy is accelerating, slowing or merely wearing expensive makeup. PLTR and ON create important AI-software and semiconductor volatility after the close. |
| Tuesday, August 4 | 8:30 AM: U.S. Trade Balance. 10:00 AM: Factory Orders. 10:00 AM: JOLTS Job Openings. Earnings: CAT, MCD, PFE, MRK, SHOP, SPOT, AMD, ANET, ALAB, BKNG, SPCX | The first major jobs clue arrives with JOLTS. After the close, AMD becomes the semiconductor referendum and SpaceX delivers its first public-company earnings report. |
| Wednesday, August 5 | 8:15 AM: ADP Employment. 9:45 AM: Final Services PMI. 10:00 AM: ISM Services. Earnings: LLY, CVS, UBER, DIS, APP, AXON, XYZ, ALB, LEU | ADP and ISM Services could move yields before Friday’s employment report. Earnings cover healthcare, consumer spending, advertising, energy transition and speculative growth. |
| Thursday, August 6 | 8:30 AM: Initial Jobless Claims. 8:30 AM: Q2 Productivity and Labor Costs. 10:00 AM: Wholesale Inventories. Earnings: COP, LNG, CEG, DDOG, QBTS, FISV, FOXA | Productivity is the sleeper catalyst. Better productivity could support growth without equivalent inflation. DDOG tests software demand; QBTS tests whether quantum enthusiasm has actual earnings bones. |
| Friday, August 7 | 8:30 AM: July Nonfarm Payrolls. 8:30 AM: Unemployment Rate. 8:30 AM: Average Hourly Earnings. 10:00 AM: Richmond Fed President Tom Barkin speaks. 3:00 PM: Consumer Credit | Friday is the macro main event. Expect the first move to be violent, the second move to be confusing and the third move to reveal what institutions actually believe. |
WHAT THE BULLS NEED
| Bulls Need | Why It Matters |
| ISM data that confirms growth without accelerating prices | Supports earnings without forcing yields higher |
| JOLTS and ADP showing orderly labor cooling | Reduces Fed pressure without signaling collapse |
| AMD guidance validating AI-chip demand | Extends semiconductor relief |
| PLTR, ANET and DDOG confirming enterprise AI spending | Broadens AI leadership beyond mega-cap cloud |
| Friday jobs near expectations | Preserves the soft-landing narrative |
| QQQ and SOXX holding earnings-gap support | Confirms institutional demand |
Bull Confirmation
- Broad market participation
- Declining Treasury yields
- Improving semiconductor breadth
- Strong closes rather than morning-only spikes
- Small-cap participation
- Positive advance-decline action
WHAT THE BEARS NEED
| Bears Need | Why It Matters |
| ISM prices paid accelerating | Renews inflation pressure |
| JOLTS or payrolls running too hot | Pushes yields higher |
| Major downward employment revisions | Raises recession fears |
| AMD or PLTR guidance disappointment | Reopens the AI valuation debate |
| SOXX losing Thursday’s rebound structure | Turns relief rally into failed bounce |
| Oil and yields rising together | Creates a two-headed valuation problem |
Bear Confirmation
- Failed earnings gaps
- Weak breadth
- Rising VIX and VVIX
- Nasdaq weakness spreading into SPY and IWM
- Defensive sectors leading
- Closing prices near daily lows
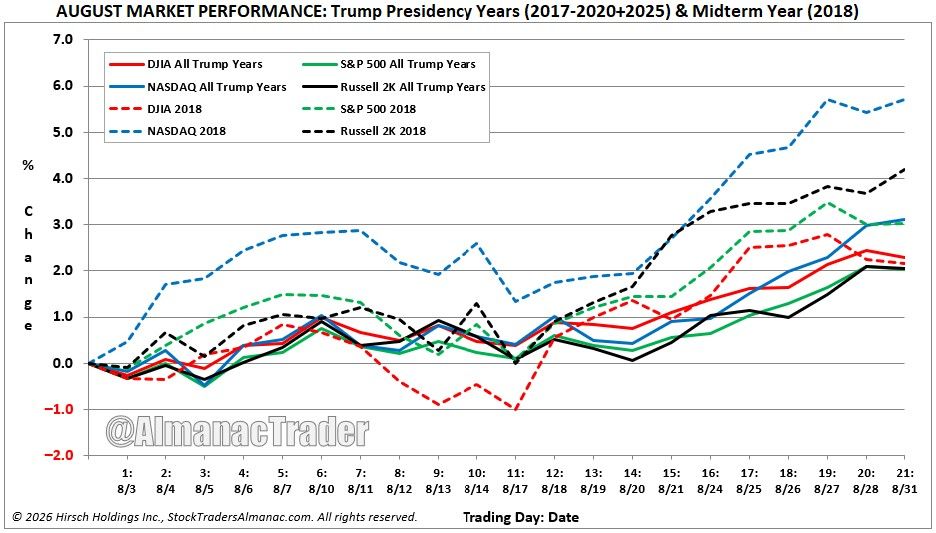
The Stock market does NOT repeat...
but it does rhyme!

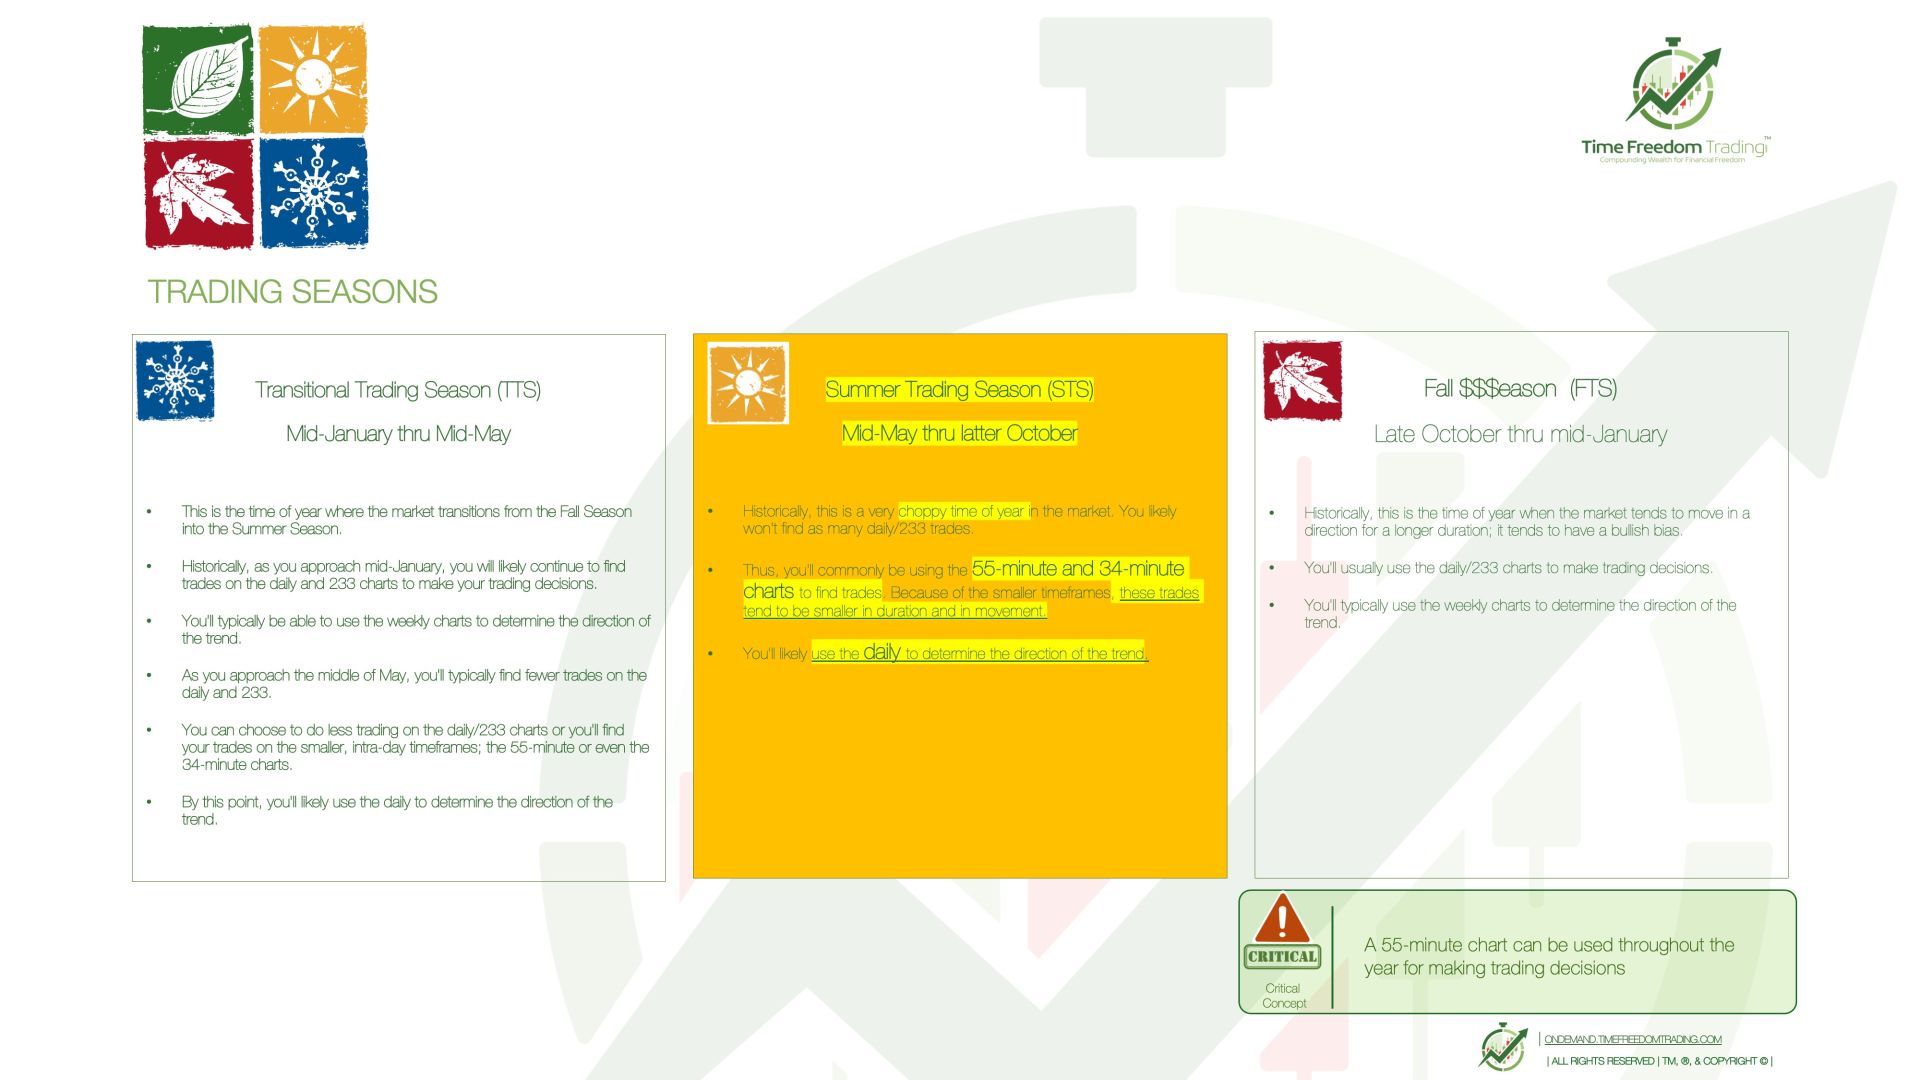
WELCOME TO
SUMMER TRADING!!!!
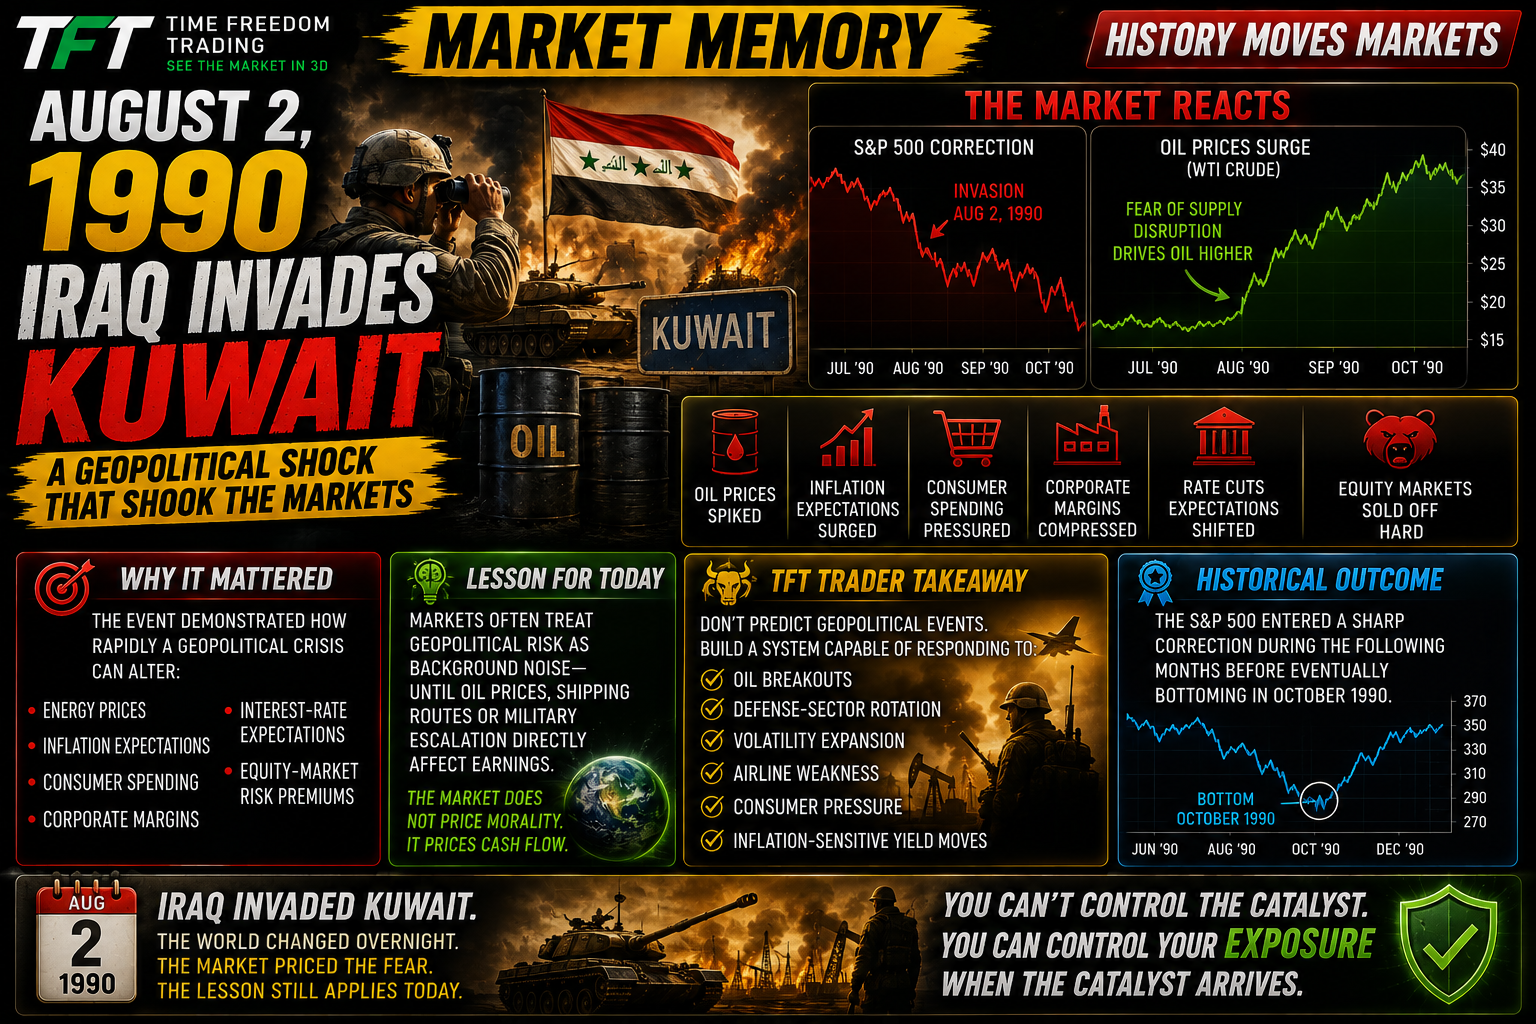
AUGUST 2, 1990 — IRAQ INVADES KUWAIT
On August 2, 1990, Iraq invaded Kuwait.
The invasion triggered a massive geopolitical shock, disrupted global energy expectations and contributed to a surge in oil prices. Equity markets sold off as investors confronted inflation risk, recession concerns and the possibility of a prolonged military conflict.
The S&P 500 entered a sharp correction during the following months before eventually bottoming in October 1990.
Why It Mattered
The event demonstrated how rapidly a geopolitical crisis can alter:
- Energy prices
- Inflation expectations
- Consumer spending
- Corporate margins
- Interest-rate expectations
- Equity-market risk premiums
Lesson for Today
Markets often treat geopolitical risk as background noise—until oil prices, shipping routes or military escalation directly affect earnings.
The market does not price morality.
It prices cash flow.
TFT Trader Takeaway
Do not predict geopolitical events.
Build a system capable of responding to:
- Oil breakouts
- Defense-sector rotation
- Volatility expansion
- Airline weakness
- Consumer pressure
- Inflation-sensitive yield moves
You cannot control the catalyst. You can control the size of your exposure when the catalyst arrives.
“The market pays you for being right… but only after it tests your patience.”
— Ed Seykota

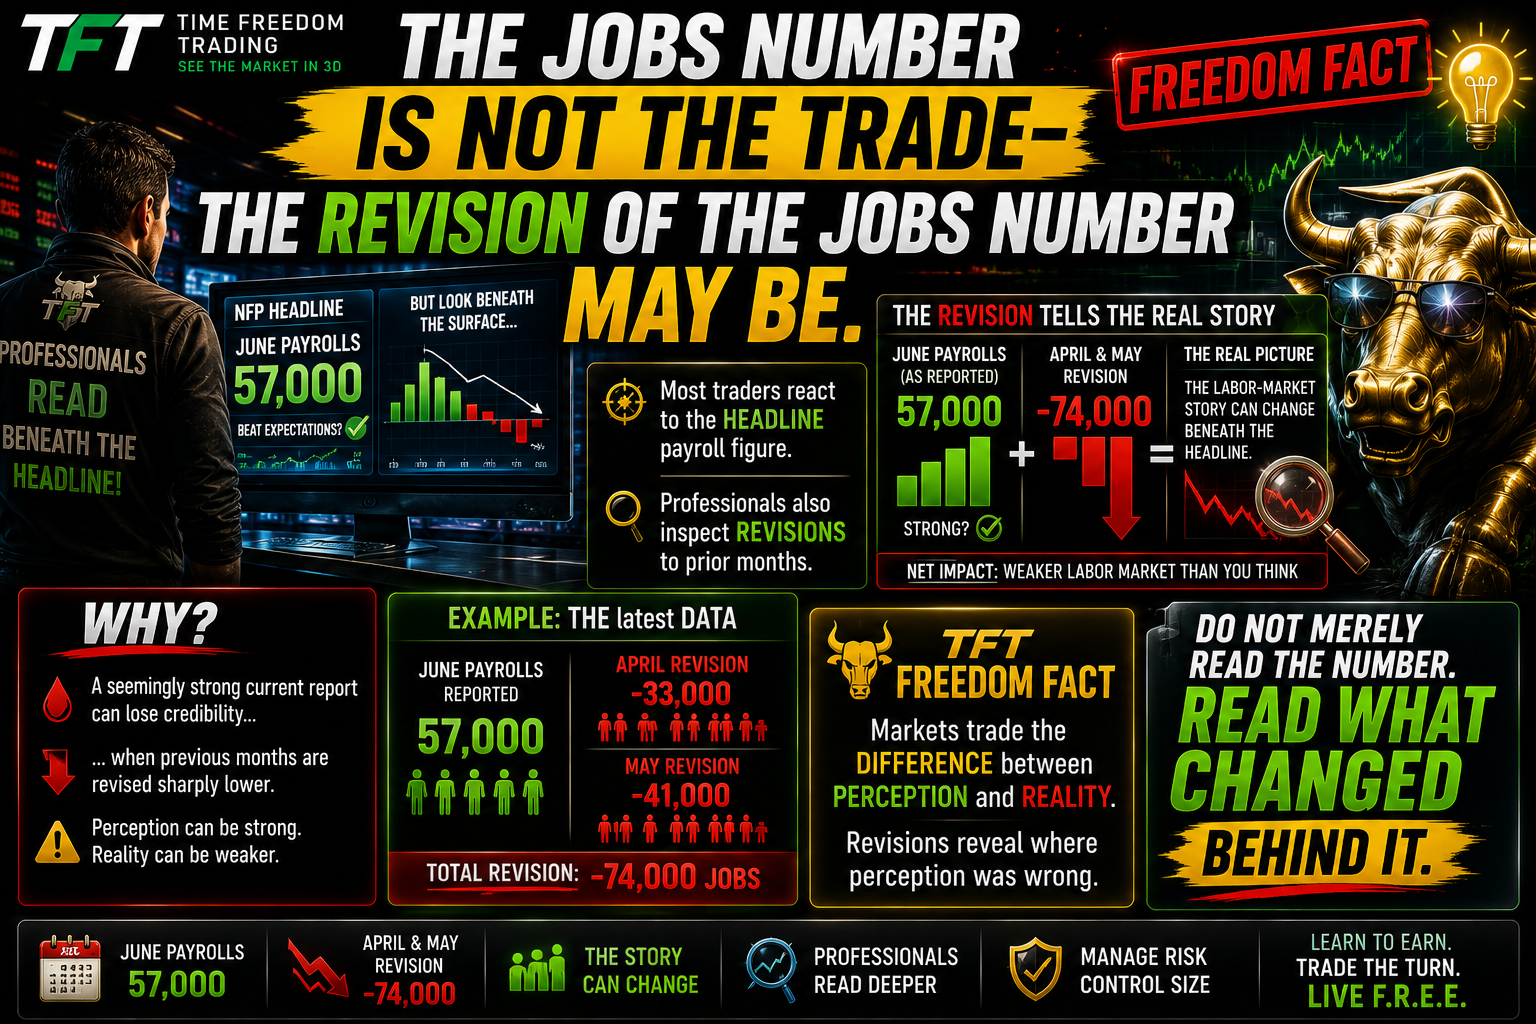
THE JOBS NUMBER IS NOT THE TRADE—THE REVISION OF THE JOBS NUMBER MAY BE.
Most traders react to the headline payroll figure.
Professionals also inspect revisions to prior months.
Why?
Because a seemingly strong current report can lose credibility when previous months are revised sharply lower.
June payrolls were reported at 57,000, while April and May were later revised down by a combined 74,000 jobs.
That means the labor-market story can change beneath the headline.
TFT Freedom Fact
Markets trade the difference between perception and reality. Revisions reveal where perception was wrong.
Do not merely read the number.
Read what changed behind it.
“The big money is not in
the buying or selling,
but in the waiting.”
| Jesse Livermore
STOCK MARKET LESSON OF THE WEEK
EARNINGS DO NOT MOVE STOCKS—EXPECTATION GAPS DO.
Apple beat portions of its reported quarter and fell sharply.
Microsoft beat expectations and exploded.
Amazon beat expectations and exploded.
The difference was not simply whether each company reported “good” numbers.
The difference was the gap between:
- What investors expected
- What management delivered
- What management projected next
That is why trading earnings based only on “beat or miss” is financial roulette with better graphics.
Daily Chart
Use the earnings gap to define the immediate battlefield.
Mark:
- Gap high
- Gap low
- Gap midpoint
- Prior closing price
-
First-hour range
Weekly Chart
Determine whether the earnings move confirms or breaks the established weekly trend.
A bullish daily gap inside a damaged weekly chart may only be a squeeze.
Monthly Chart
Use the monthly trend to understand the institutional backdrop.
A stock can be bearish daily, damaged weekly and still structurally bullish monthly.
That is how you see the market in 3D.
The TFT Takeaway
The catalyst creates volatility.
The chart determines whether you have a trade.
Do not gamble through earnings because you hope management says the magic words.
Trade the pre-earnings IV rush.
Trade the post-earnings reaction.
Trade the gap structure.
Let someone else donate tuition to the IV-crush university.

“The plans of the diligent lead surely to abundance, but everyone who is hasty comes only to poverty.”
— Proverbs 21:5
The market will offer more volatility next week than most traders can responsibly handle. Manufacturing, labor data, yields and earnings will all compete to move prices. The temptation will be to react to every headline as though each candle contains your financial destiny.
It does not.
Your advantage comes from preparation before participation. Know the catalyst. Know the trend. Know the expected move. Know the invalidation level. A trader without a plan does not become flexible under pressure. He becomes available liquidity for someone who prepared better.
Actionable Summary
- Build your earnings watchlist before Monday.
- Mark every major economic release on the calendar.
- Define bullish and bearish scenarios in advance.
- Reduce position size around binary events.
- Wait for price confirmation.
- Protect capital from emotional urgency.
- Review the weekly chart before trading the daily reaction.
The goal is not to catch every move.
The goal is to remain solvent, disciplined and positioned for the moves that match your edge.
THE FINAL WORD...
THE MARKET WILL BE EMPLOYED NEXT WEEK. WILL YOUR MONEY BE?
Next week brings five trading days filled with economic reports, earnings gaps, yield moves and volatility.
Most people will watch it happen.
They will read the headlines.
Argue about the Fed.
Complain that stocks are too expensive.
Then return to a job that exists largely because their money never learned how to clock in.
The answer is not reckless trading.
The answer is a Wealth Operating System.
A disciplined system that teaches you how to:
- See the market in three dimensions
- Follow catalysts
- Read institutional rotation
- Control risk
- Trade actively
- Invest passively
- Build a Financial Flywheel
That is the purpose of The Seven Figure Way and the Time Freedom Trading system.
Not to make you addicted to screens.
To make your money more productive than your calendar.
Begin building the system that can move you from employee—to earner—to owner.
What will your future look like if you keep hitting pause on your dreams to build someone else’s with your 9-to-5?
Your money does not need another lunch break.
It needs a job description.
Learn to earn. Trade the turn. Make More. Live F.R.E.E.
Want to
"SEE"
the Market
Correctly?
SEE the Market
Like a Time Freedom Trader!
Most people stare at charts the way rookies stare at MRI scans —
lots of squiggles… zero understanding… and a whole lot of “uhhh, is this bad?”
Time Freedom Traders don’t look at the market.
We see it — in 3D, in real time, with clarity sharp enough to slice through Wall Street noise.
We see:
-
Rotation before it rotates
-
Catalysts before they explode
-
Turns before they trend
-
Opportunities while everyone else is still doom scrolling
This is the difference between traders and operators.
One guesses.
One reads the market like a playbook.
And it starts with using the right tools.
If you want to see what we see, the way we see it —
you need charts that don’t lie, lag, or limit your edge.
That means TradingView.
- Clean charts.
- Real-time data.
- Precision tools.
- Time Freedom Trading Custom Indicators - to "See" the MOVES correctly!
Everything you need to trade the turn, not chase the move.
👉 Sign up for TradingView today and start seeing the market like a Time Freedom Trader.
Your clarity starts the moment your charts go HD.
Because remember —
You’re just one trade away.

LIVE LIKE
A SUPER HERO!
A SUPER HERO!
If you’re ready... it’s time to level up.
Join our Coaching Cohort, where we teach traders how to:
- Think like a Trader and Investor
- Build your own "consistency code"
- Grow into Profits with Providence.
No more hesitation. Just a proven path to financial freedom.
Click below to join the Time Freedom Trading Coaching Cohort and start trading the $1KWay today!
Join the TIME FREEDOM TRADING Coaching Cohort Today!
Discover how Time Freedom Trading can help you start building your Financial Flywheel and your trading plan to HIT SIX in 2026!
Freedom awaits—are you ready to claim it?
| Clinton - The "Bald Bull" James

P.S.S. PLEASE PAY IT FORWARD!
GIVE TIME FREEDOM - SHARE THIS LINK
Every one deserves Time Freedom!
If you know someone who would like to learn to earn time freedom, please forward this email / link and share the freedom!
Your network will appreciate it (and remember you) for sharing thoughtful content.
If you enjoyed this micro-lesson please share this link on social.


Get the "GET FREE" Bundle

10 TIME FREEDOM TRADING TACTICS YOU WILL LEARN!
- Learn your real freedom number to earn time freedom trading in the stock market. (it's smaller than you think!)
- Learn how to see market manipulation by large institutional investors and profit from their movements.
- Learn how to make money in an up, down, or sideways market. More importantly, you will learn a quantitative approach to know when NOT to trade in the stock market to protect your capital.
- Develop the proper paper trading skills and processes to prove your trading ability in the stock market before risking a single dollar!
- Learn the proper trading chart configurations to see the markets in 3D and clearly see market moves before your trade!
- Understand the difference between retail trading (prey) and professional trading (predator)strategies and how to profit from both mindsets in the stock market.
- Learn simple trading strategies that only require 5th-grade math. No complex calculations or buzzwords to confuse you.
- Create simple automated trading tactics with your
broker that allow you to place a simple trade on autopilot and minimize
your risk while maximizing your gain for a trade.
- Join a live daily trader community chat that will discuss market moves in real-time to accelerate your learning and close your experience gap faster.
- Experience the seasonality of the stock market with a veteran trader to learn how to profit in all months and seasons of the year to earn time freedom!
✓ Quantified Strategies: Learn to identify repeatable trading patterns to profit in the markets with systematic, data-driven methods.
✓ Practical Examples: Real-world cases, demonstrated strategies in action.
✓ Consistent Results: Strategies that have proven successful for decades are now accessible to you.




When your ready;
There are five (5) ways I can help.

1.0 Subscribe to
The GET F.R.E.E. Report
Join the Time Freedom Trading Community. SIGN UP for The GET F.R.E.E. REPORT newsletter and learn how to earn TIME FREEDOM from your INBOX! Get trading strategies and get elements of the Time Freedom Trading Operating System in your inbox! Time Freedom Awaits!
The GET F.R.E.E. REPPORT
2.0 Subscribe to
TIME FREEDOM TRADING TACTICS
Get an "investing lesson" on the 1st of every month in your inbox with simple tactics you can implement immediately to start earning time freedom.
TIME FREEDOM TRADING TACTICS
3.0 The Time Freedom Trading
ON DEMAND COURSES
The #1 On-demand Trading Curriculum for learning Trading MECHANICS, Trading DYNAMICS, Trading STRATEGY, and Trading MINDSET.
Join the TIME FREEDOM TRADER COMMUNITY in our flagship courses. Time Freedom Trading teaches you exactly how to lose less and make more by learning a simple system to compound profits in the stock market.
Come inside and get over 25 years of trading expertise, proven methods, and actionable strategies to help Main Street earn Wall Street profits by trading and investing in the stock market.
Ondemand.TimeFreedomTrading.com
4.0 The Time Freedom Trading COACHING COHORT
Join Time Freedom Traders learning "live and in real-time" the seasonality of the stock market. This comprehensive Trader Coaching Cohort will teach you 1:1, in live Cohort sessions, and open office hours, specifically how to trade the seasons of the stock market and learn from live Market Moments for profitable trading strategies.
The WINTER, SPRING, SUMMER, and FALL seasons all have different dynamics to profit from in the stock market. Build the proper knowledge, process, and skills to leverage the exact system I used to gain TIME FREEDOM all year through by effectively trading the stock market with seasonal catalysts. Grow your account with real money with the $1K to $100K Way and earn time freedom your way.
Time Freedom Trading Coaching Cohort
5.0 The FREEDOM FRIENDS & FAMILY AFFILIATE PROGRAM

Join the Time Freedom Trading Affiliate Program at no cost to you, and GET PAID to share the gift of TIME FREEDOM with friends and family. Refer others to Time Freedom Trading and share your personal affiliate link ID to earn a commission on every offering we sell.
Help Time Freedom Trading scale to reach more TIME FREEDOM TRADERS and fund your $1K WAY to earn time freedom. Become a partner to scale the Time Freedom Trader Community.
Giving back and paying it forward with Time Freedom Trading is a WIN-WIN for all!
BECOME A FREEDOM FRIENDS & FAMILY AFFILIATE
"Wall Street never changes. The pockets change, the suckers change, the stocks change, but Wall Street never changes, because human nature never changes."
- Jesse Livermore

SUBSCRIBE TO THE NEWSLETTER
Join TIME FREEDOM TRADERS who are readers of
The W.ith T.ime F.reedom Report for exclusive tips, strategies, and resources to learn how to trade and invest in the stock market.

Register for the
FREEDOM FRIENDS & FAMILY
AFFILIATE PROGRAM!

Get More WTF REPORT!

26 DECISIONS THAT WILL DECIDE YOUR 2026
#45 STOP PAYING IGNORANCE TAX

NEW YEAR: UNCERTAIN TIMES. CERTAIN EDGE.

#44 YOUR TRAINING YOUR AI REPLACEMENT.

#4 FIVE (5) REASONS EVERYONE SHOULD LEARN TO TRADE THE STOCK MARKET

# 38 FIVE YEARS FROM NOW, YOU'LL ARRIVE SOMEWHERE!

#40 Feeling FOMO for Missing the NVIDIA AI Bubble?
Share this Article on:
Learn to Earn Time Freedom;
FREE TO LIVE YOUR LIFE YOUR WAY!

Join us today
Join us today
Join us today
THANK YOU
Join us today
Join us today
Join us today

Learn to earn and earn time freedom with your profits in the stock market. Time Freedom Trading is helping MAIN STREET earn WALL STREET profits through real trading and investing strategies.
Forget the dogma of "set it and forget it" tactics with passive investing that keeps your advisor rich with fees and your account balance diminished with under performing portfolio strategies.
Time Freedom trading is helping MAIN STREET earn WALL STREET PROFITS. Can you afford to NOT find out? What is your old way of investing really costing you. Get started with TIME FREEDOM TRADING today!
Sponsor this Newsletter!
Have questions?
Hit reply to this email and we'll help out!

You are receiving this note because you joined us at one of the Time Freedom Trading websites.
Copyright © www.TIMEFREEDOMTRADING.com
All rights reserved.
About www.TIMEFREEDOMTRADING.com
THE TIME FREEDOM TRADING SYSTEM empowers Main Street with Wall Street knowledge and tools to compound wealth and earn time freedom through proven trading and investing strategies. Learning how the stock market works from the inside is critical to compounding wealth consistently in any market environment. Time Freedom Trading empowers you to build your own financial flywheel based upon your skills and goals. Regardless of the technology or market volatility, with TIME FREEDOM TRADING you will have the right mentor and mental coach who will reveal the patterns in human nature that don’t repeat but do rhyme which you can profit from. Whether it’s stocks, options, exchange-traded funds (ETFs), or futures, we empower you with an effective skill set and tools for everyone at every level of experience to earn time freedom.
Life is short.
MAKE IT WORTH WHILE!
Compounding wealth with Time Freedom Trading can make it long and worthwhile.
Earn time freedom to enjoy life, enjoy your family, and enable the life and legacy you deserve.
Become a Time Freedom Trader Today!
Your Time Freedom Awaits!
TIME FREEDOM TRADING DOES NOT PROVIDE RECOMMENDATIONS OR ADVICE.
FOR EDUCATIONAL AND INFORMATION PURPOSES ONLY; NOT ADVICE. TIME FREEDOM TRADING content is offered for educational and informational purposes only and should NOT be construed as a securities-related offer or solicitation or be relied upon as personalized financial advice. We are not financial advisors and cannot give personalized advice. There is a risk of loss in all trading, and you may lose some or all of your original investment. Results presented are not typical. Please review the full risk disclaimer
LEGAL DISCLAIMERS
ADDITIONAL RISKS