
Read More of
The GET F.R.E.E. Report
Friday August 14, 2026

WEEK 33
August 10th-14th, 2026
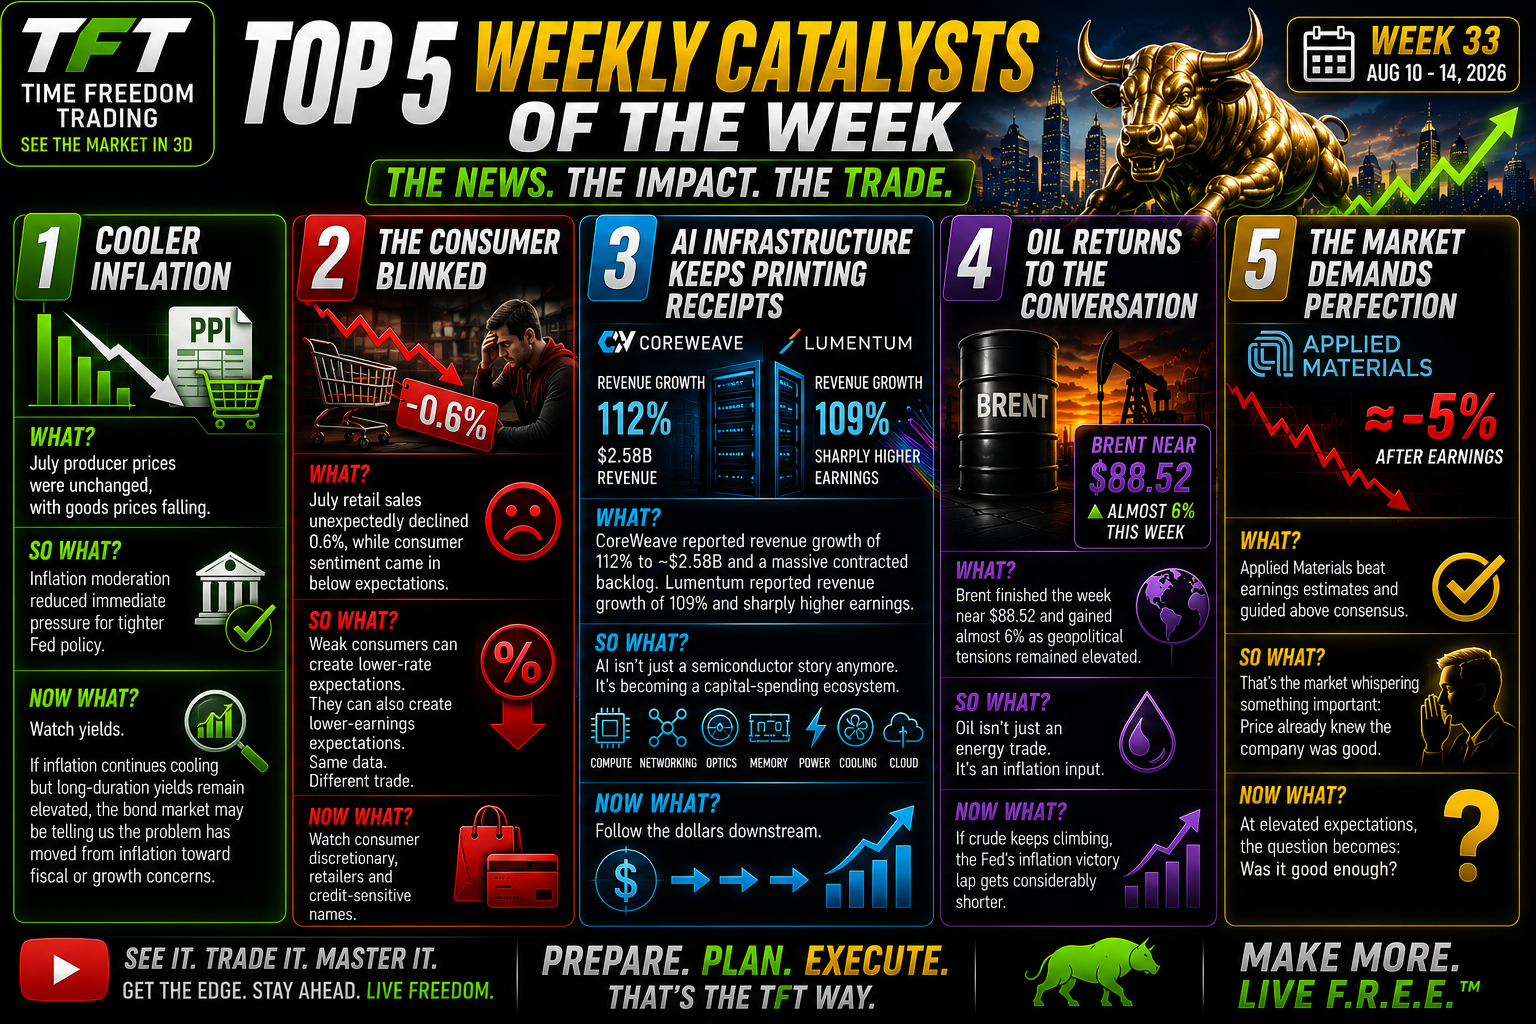
“RECORDS, ROTATION &
THE PRICE OF PERFECTION"
MAKE MORE. LIVE F.R.E.E.™
Wall Street spent the week doing what Wall Street does best: making everyone simultaneously bullish, nervous and convinced they should have bought something three days ago.
The headline indexes stayed near record territory. The gained about 0.4% for the week, the added about 0.1%, and the gained roughly 1.1%. The slipped about 0.6%. Friday itself finished softer: S&P 500 −0.2%, Nasdaq −0.3%, Dow −0.2%, while the Russell rose 0.5%.
That's the scoreboard.
The more important story was underneath it:
Rotation.
Small caps continued outperforming. AI infrastructure remained powerful. Memory and optical-networking names attracted capital. But several companies delivered perfectly respectable earnings and still got punched in the face.
Welcome to a market where good isn't always good enough.
The Week in Review :
1. WEEKLY SUMMARY
— THE MARKET IN 3D™
The S&P 500 reached another record during the week, while the Russell 2000 also pushed into record territory. AI hardware and infrastructure remained major leadership areas, but Friday exposed increasingly selective behavior in semiconductors and software.
PRICE
The broad trend remains constructive.
But don't confuse a rising index with permission to buy everything wearing an AI nametag.
PARTICIPATION
Friday gave us an interesting divergence.
The Nasdaq weakened while the Russell 2000 advanced.
Energy, utilities, materials, real estate and industrials showed relative strength as semiconductor and software stocks weakened.
That's rotation.
CATALYST
Inflation data generally cooled, but Friday's weaker retail-sales data reopened the growth question. Meanwhile, oil and Treasury yields climbed into the weekend.
TFT READ: The bull isn't dead.
He's just changing lanes.
WEEKLY MARKET INTERNALS
2. WEEKLY MARKET INTERNALS
The surface remains bullish, but internals demand more discrimination.
The VIX finished around 14.25, its lowest level since December according to Barron's, showing remarkably little fear despite geopolitical uncertainty and economic crosscurrents.
At the same time, small-cap strength suggests participation continues broadening beyond the largest technology names.
That's healthy—until it isn't.
Low volatility can support trends.
It can also create complacency.
TFT Translation:
Don't fear a quiet market.
Fear becoming lazy because the market is quiet.
SECTOR ROTATION READ
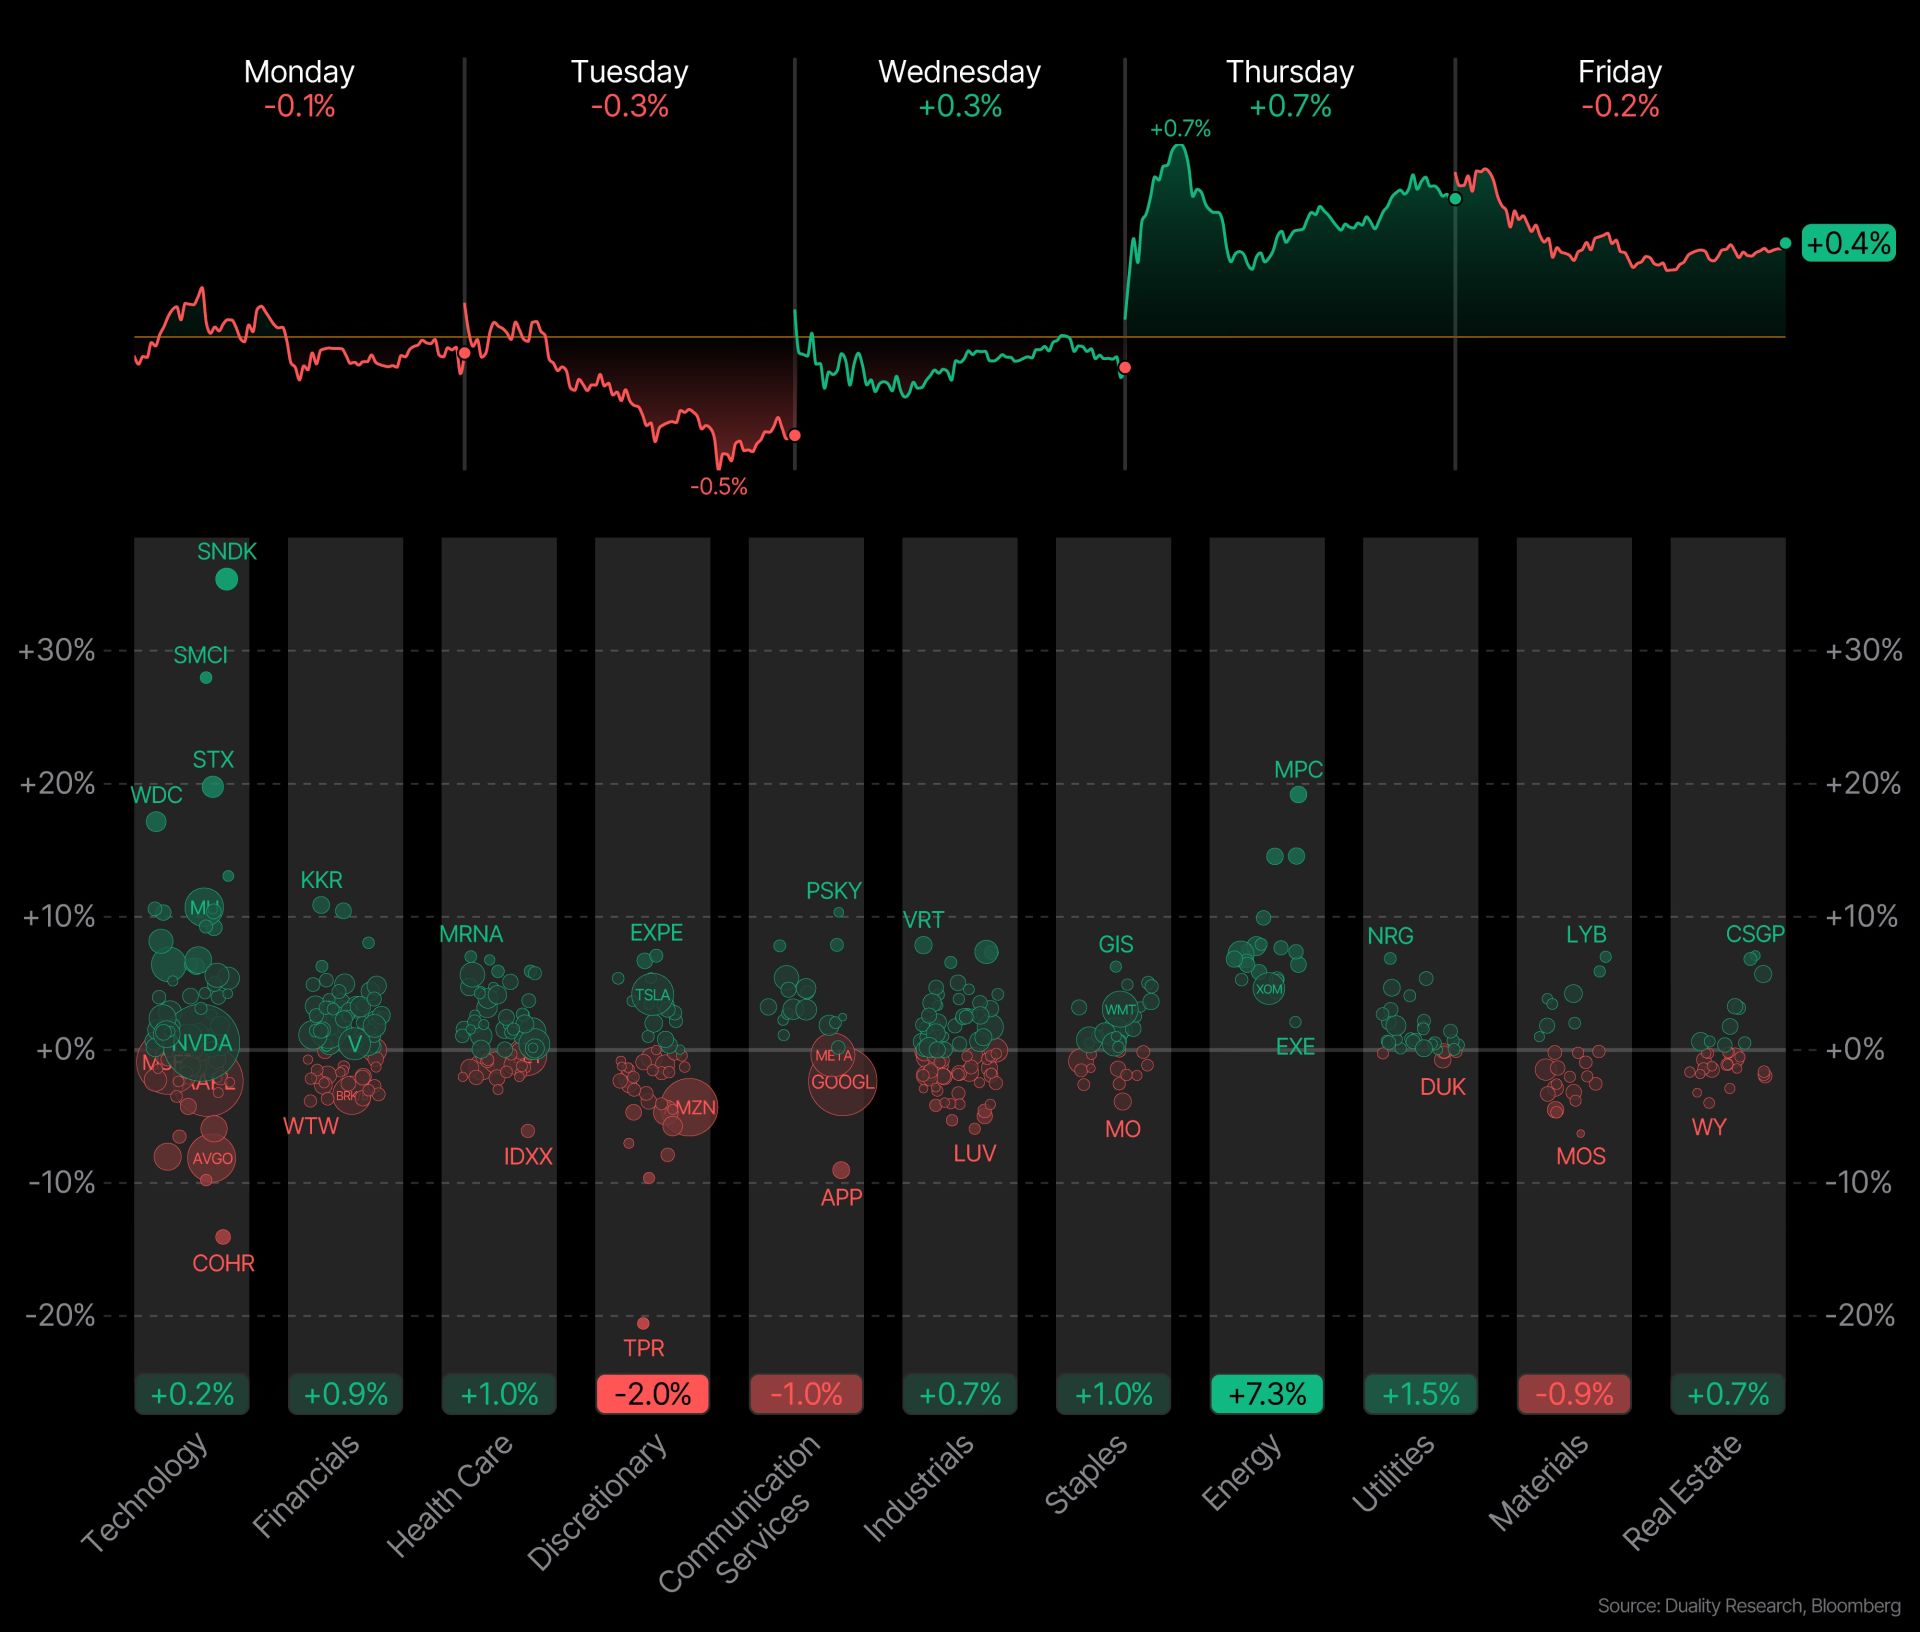
🇺🇸 The S&P 500 rose +0.36%
⚖️ The average stock returned +1.22%
💪🏼 270 stocks outperformed the index
📈 Best sector: Energy +7.3%
📉 Worst sector: Discretionary-2.0%
📈 Best stock: SNDK +35.4%
📉 Worst stock: TPR -20.6%
POSITIVE SECTORS
Small Caps — Russell 2000 +1.1% weekly and +23.6% YTD.
Energy — strengthened Friday as crude climbed.
Industrials / Materials — showed relative strength into the weekend.
Memory / AI Infrastructure — SanDisk, Nebius, CoreWeave and Lumentum reinforced continued capital spending across the AI ecosystem.
NEGATIVE SECTORS
Semiconductor Equipment — Applied Materials fell despite a beat and strong guidance.
Software — weakened Friday.
Mega-cap Growth — leadership became less uniform.
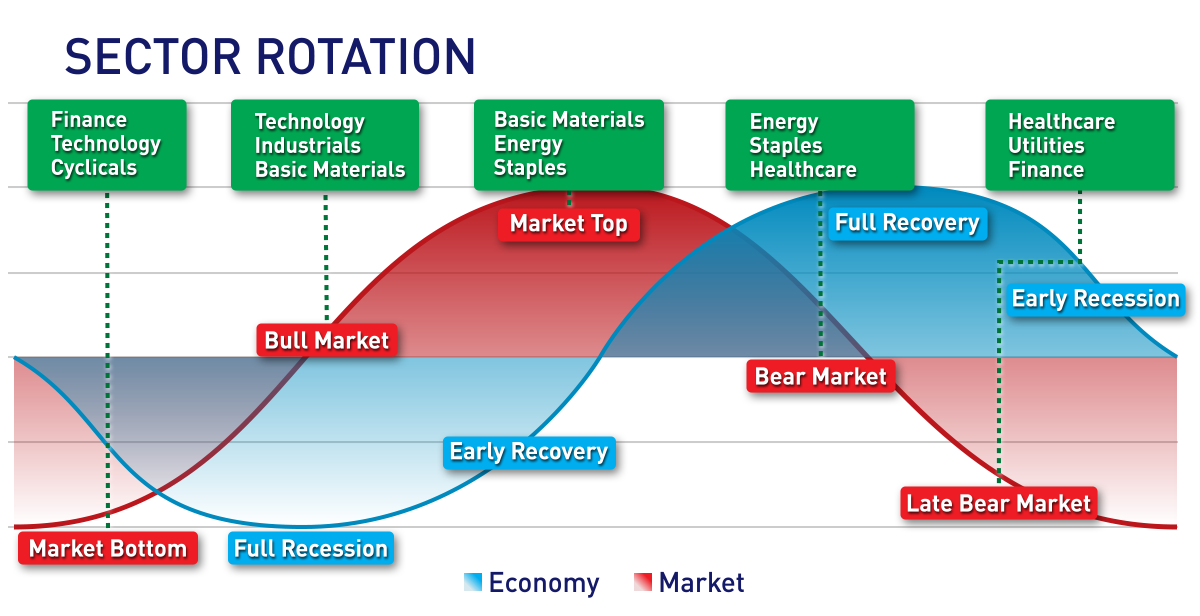
SECTOR ROTATION CYCLE READ
Money isn't abandoning technology.
It's becoming more selective inside technology while simultaneously expanding toward smaller companies and economically sensitive sectors.
That's important.
The next phase of the rally may not look exactly like the last phase.
Follow rotation, not reputation.
MARKET HEAT MAP - LIVE
TOP 5 TRADES
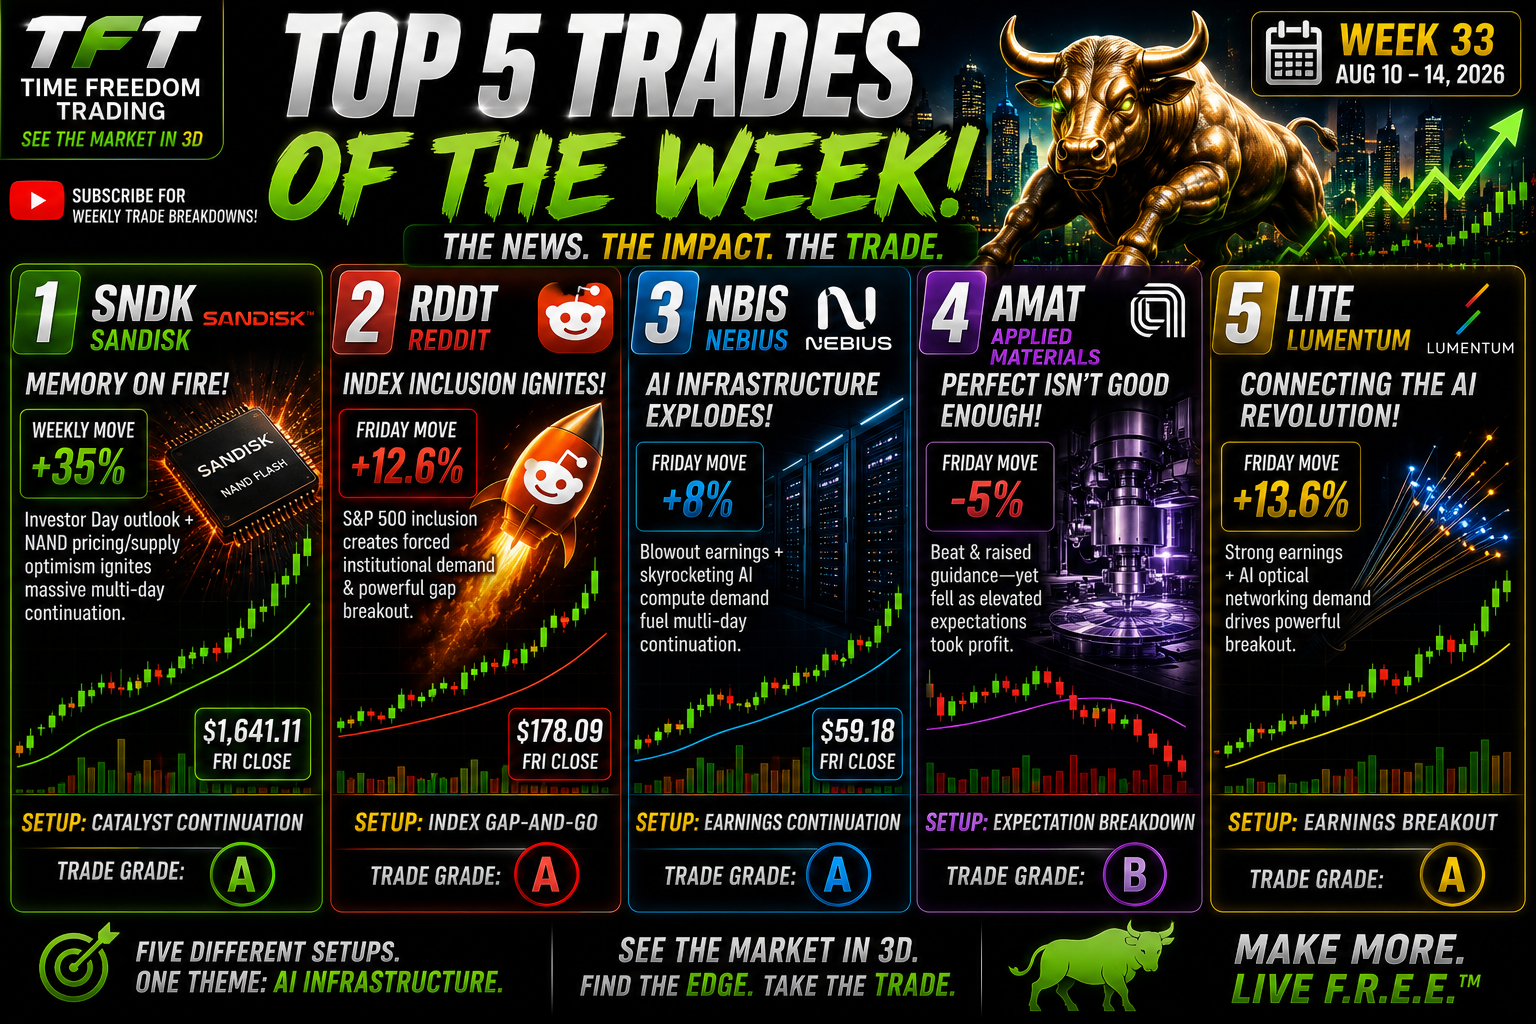
KEY TRADES OF THE WEEK:
NASDAQ TECH MOVERS
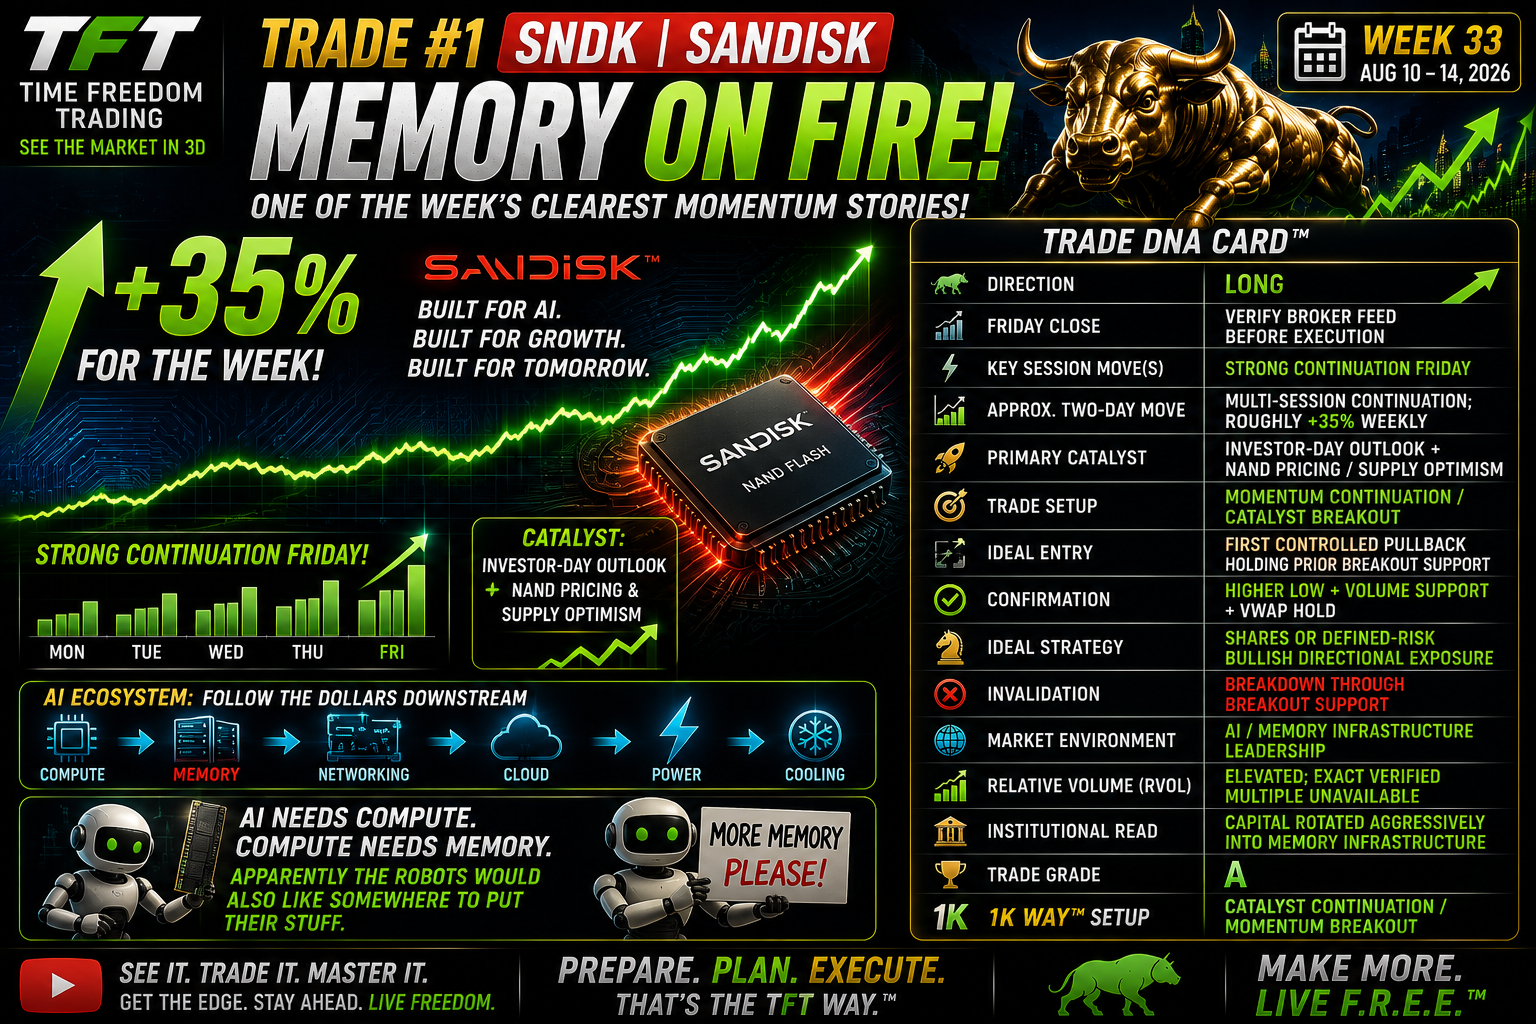
TRADE #1 — SNDK | SANDISK
INVESTOR DAY CONFIRMS THE MEMORY REBOUND
SanDisk delivered one of the week's cleanest examples of what happens when technical exhaustion meets a fundamental catalyst.
This wasn't simply a stock that suddenly decided to rally.
The setup had been developing.
SNDK had suffered a brutal correction from its prior highs as the market aggressively repriced the memory cycle. The selling eventually became overextended as traders increasingly treated weakening DRAM/NAND expectations as though demand had fallen off a cliff.
Then price began telling a different story.
THE SETUP — THE SELLING BECAME OVERDONE
The first clue was the rebound from the lows.
SNDK stopped making meaningful downside progress and began rebuilding its structure. Buyers started absorbing supply.
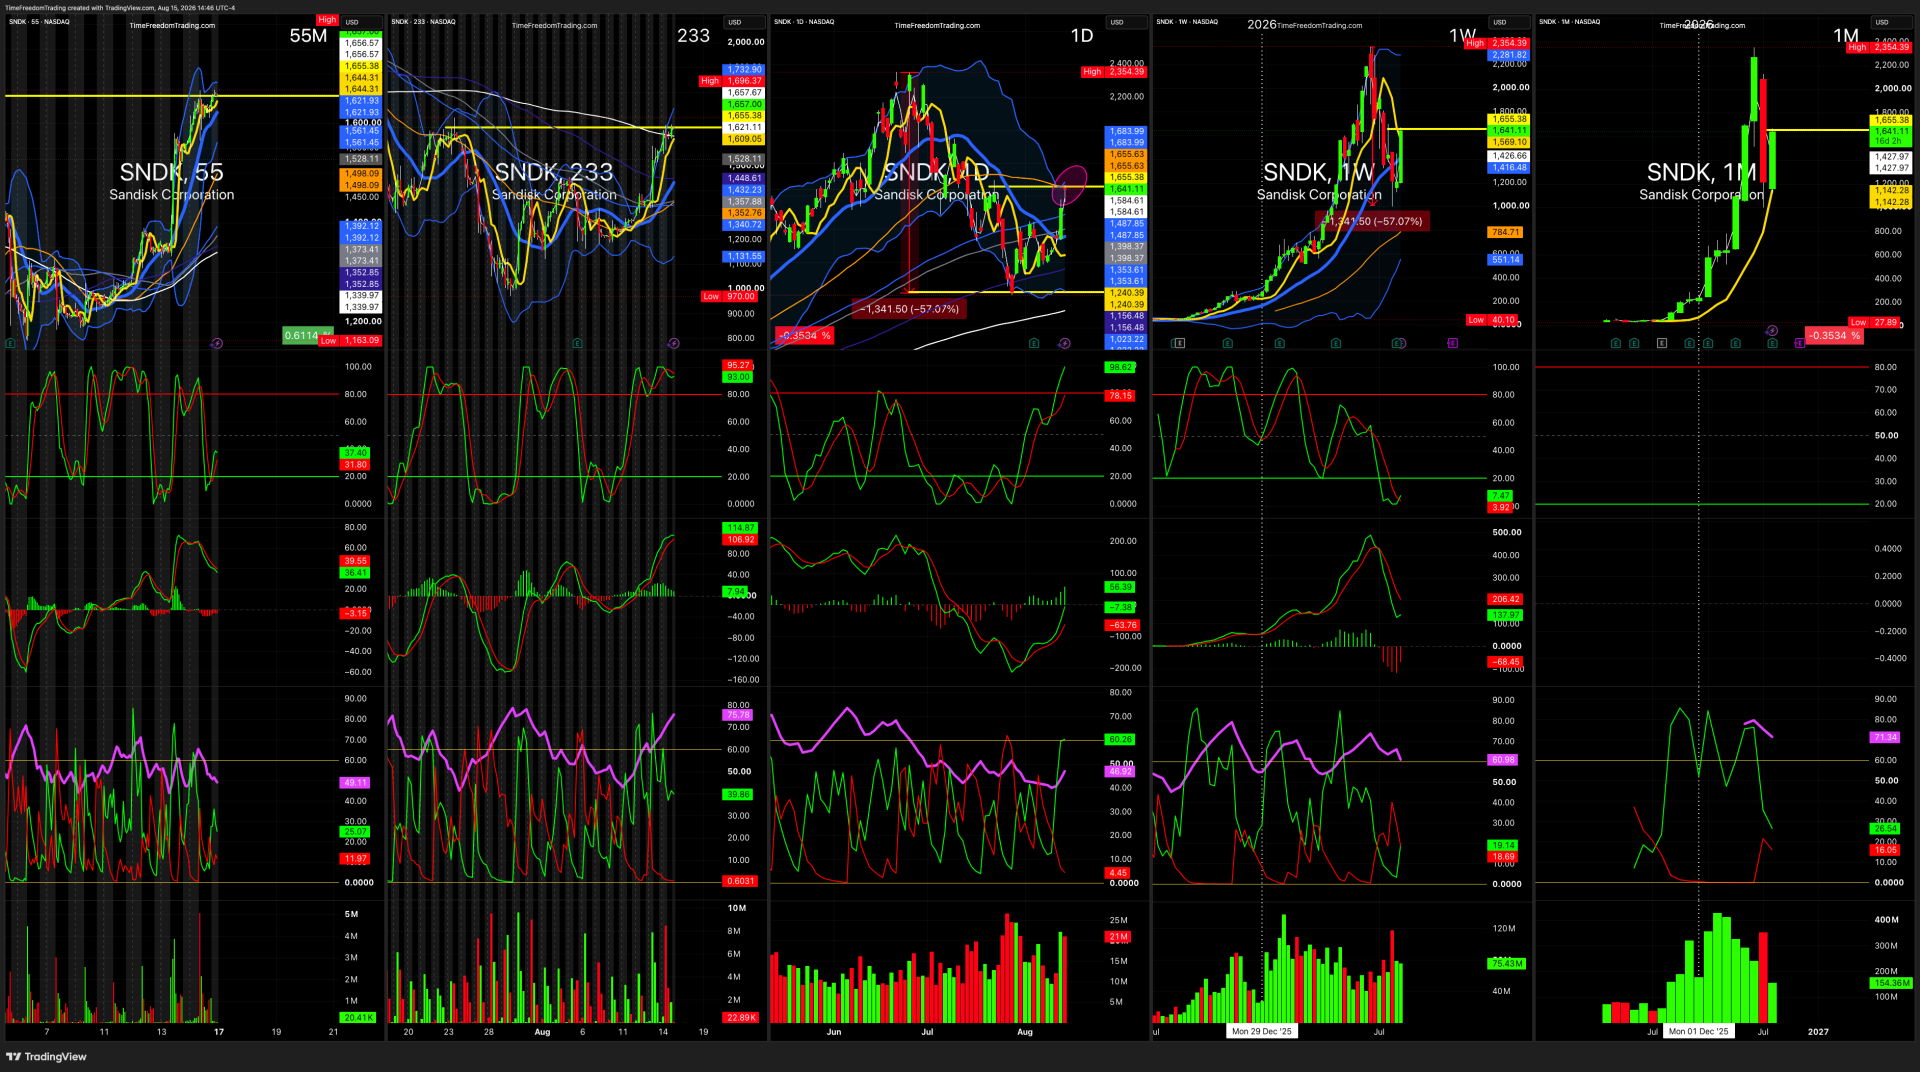
Most importantly, on the Daily Trade Chart, SNDK recovered and retook its 50-day moving average.
That matters.
The 50MA had gone from overhead resistance to a potential support reference. Instead of another failed bounce inside a larger decline, the stock was beginning to demonstrate evidence of a legitimate trend reversal.
But technical improvement alone wasn't enough.
SNDK needed a catalyst capable of validating the chart.
Investor Day delivered it.
THE CATALYST — INVESTOR DAY CHANGED THE NARRATIVE
SanDisk's Investor Day gave Wall Street something substantially more valuable than another optimistic AI story.
It provided fundamental confirmation.
Management's longer-term outlook reinforced the thesis that demand for memory remains strong while supply constraints continue creating scarcity across the memory ecosystem.
That's the key.
Demand + constrained supply = pricing power.
Pricing power can create stronger margins.
Stronger margins can create stronger profits.
And stronger expected profits force institutions to reconsider what they're willing to pay for the stock.
Investor Day therefore became the bridge between the technical rebound and the fundamental thesis.
The chart was already improving.
The catalyst gave institutions a reason to believe the improvement.
THE MOVE — CATALYST + STRUCTURE + VOLUME
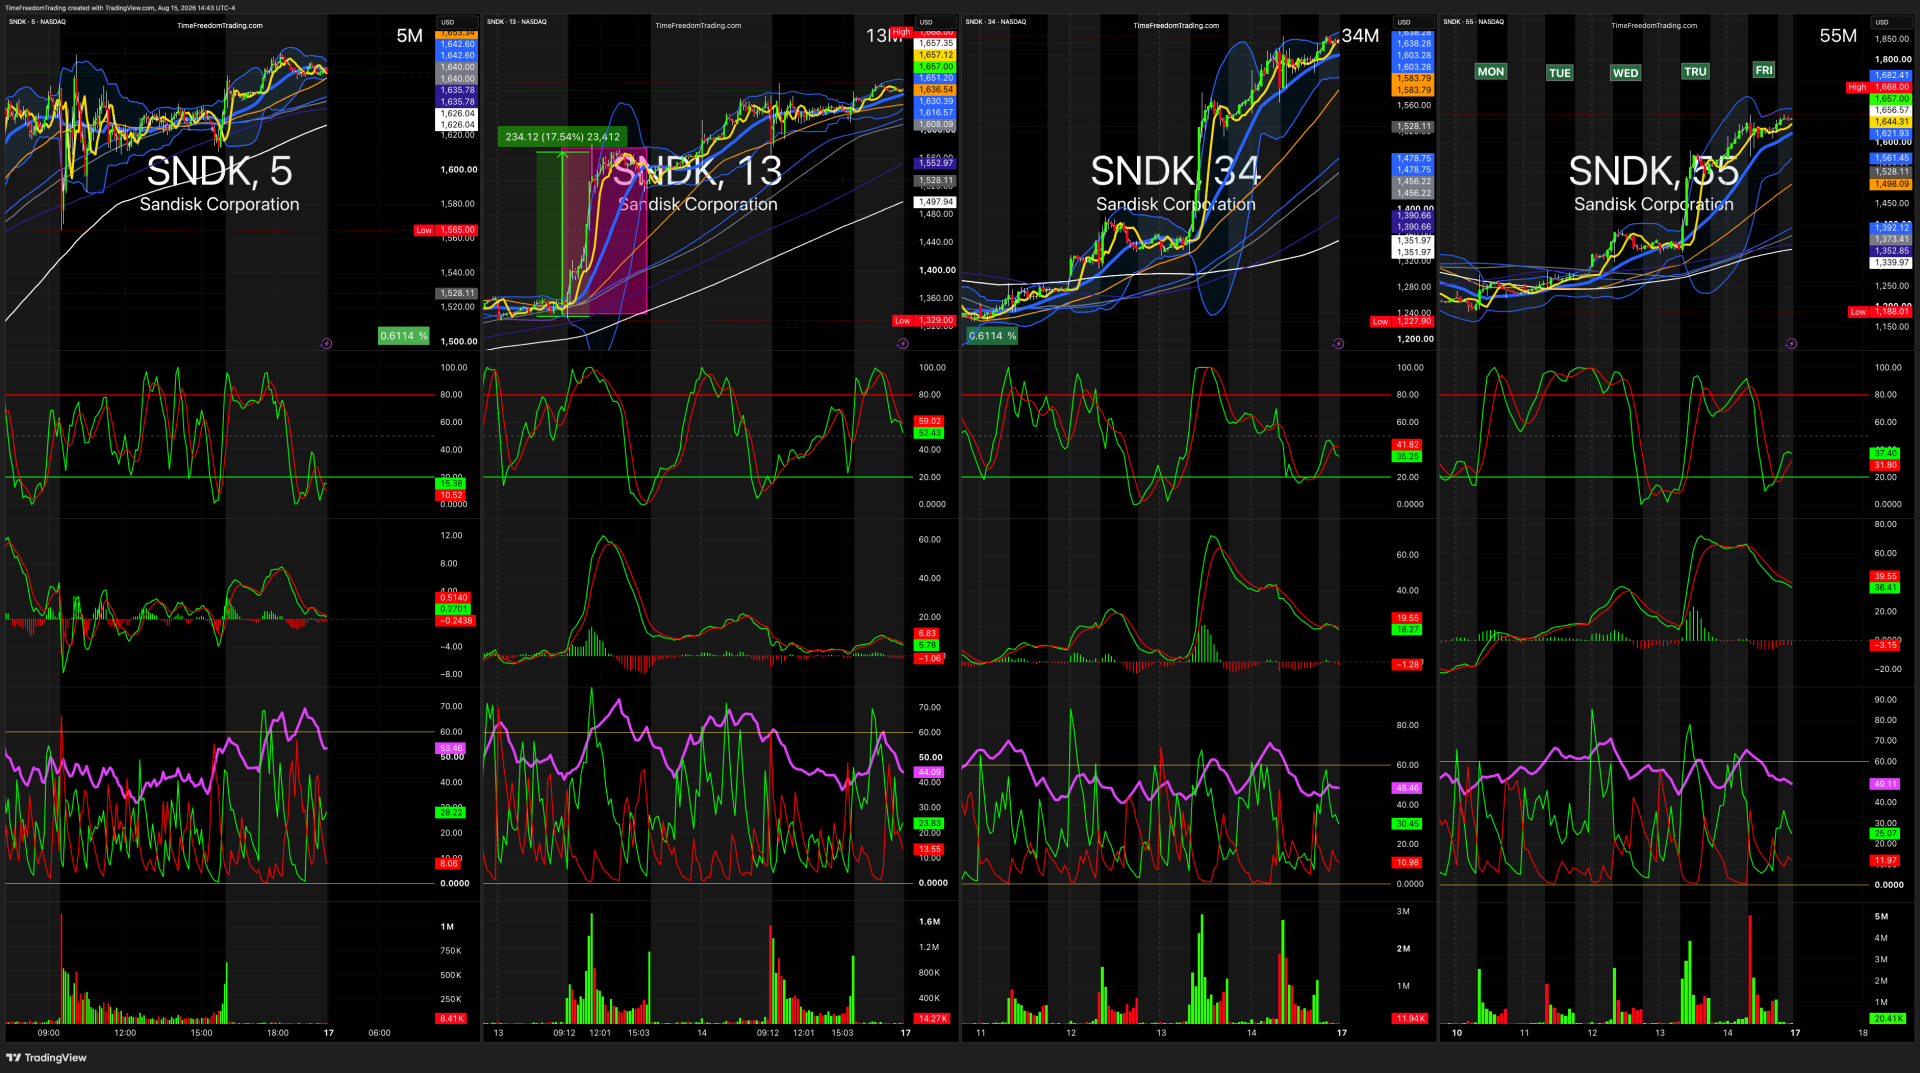
Once Investor Day validated the memory-demand story, SNDK accelerated.
The stock produced a powerful multi-day continuation and finished Friday around $1,641.11, completing roughly a 35% weekly advance.
More importantly, the move wasn't an isolated opening spike.
Price continued holding higher levels.
Volume expanded.
Pullbacks found buyers.
The 50MA reclaim remained intact.
That's what transforms:
“Stock went up.”
into:
“Institutional repricing may be occurring.”
TRADE DNA CARD™
| Metric | TFT Read |
|---|---|
| Direction | LONG |
| Friday Close | $1,641.11 |
| Key Session Move(s) | Investor Day breakout followed by strong multi-day continuation |
| Approx. Weekly Move | ≈ +35% |
| Primary Catalyst | Investor Day + stronger memory-demand outlook + NAND supply/pricing optimism |
| Technical Catalyst | Daily reclaim of the 50MA following an overextended selloff |
| Trade Setup | Catalyst Reversal → 50MA Reclaim → Momentum Continuation |
| Ideal Entry | Controlled pullback after the breakout holding reclaimed support / 50MA structure |
| Confirmation | Higher low + expanding volume + VWAP hold + 50MA acceptance |
| Ideal Strategy | Shares or defined-risk bullish directional exposure |
| Invalidation | Failed breakout followed by loss of reclaimed Daily support |
| Market Environment | AI infrastructure + memory leadership |
| RVOL | Elevated during catalyst sessions |
| Institutional Read | Investor Day forced institutions to reassess the severity of the memory slowdown |
| Trade Grade | A |
| 1K WAY™ Setup | Catalyst Reversal + 50MA Reclaim + Momentum Continuation |
MACRO CHARTS
INTRADAY CHARTS
ART IN THE CHART™
The real trade wasn't simply:
“SNDK had Investor Day. Buy it.”
The edge came from the sequence:
OVERDONE SELLING
↓
LOW FORMS
↓
MULTI-DAY REBOUND
↓
DAILY 50MA RECLAIM
↓
INVESTOR DAY CATALYST
↓
MEMORY DEMAND THESIS CONFIRMED
↓
VOLUME + PRICE EXPANSION
↓
MOMENTUM CONTINUATION
That's seeing the market in 3D.
The chart showed the turn.
The catalyst explained the turn.
Volume confirmed that institutions believed the turn.
TFT READ
The larger lesson isn't just SanDisk.
It's the memory cycle.
AI requires extraordinary amounts of compute.
Compute requires memory.
And when demand expands faster than available supply, scarcity creates something Wall Street understands very well:
Pricing power.
SanDisk's Investor Day helped confirm that the market may have become too pessimistic about the memory cycle.
The chart began whispering it first.
Investor Day gave Wall Street the receipt.
Then volume started shouting.
AI needs compute.
Compute needs memory.
And apparently the robots would also like somewhere to put all their stuff.
Trade the catalyst. Confirm the structure. Follow the money.

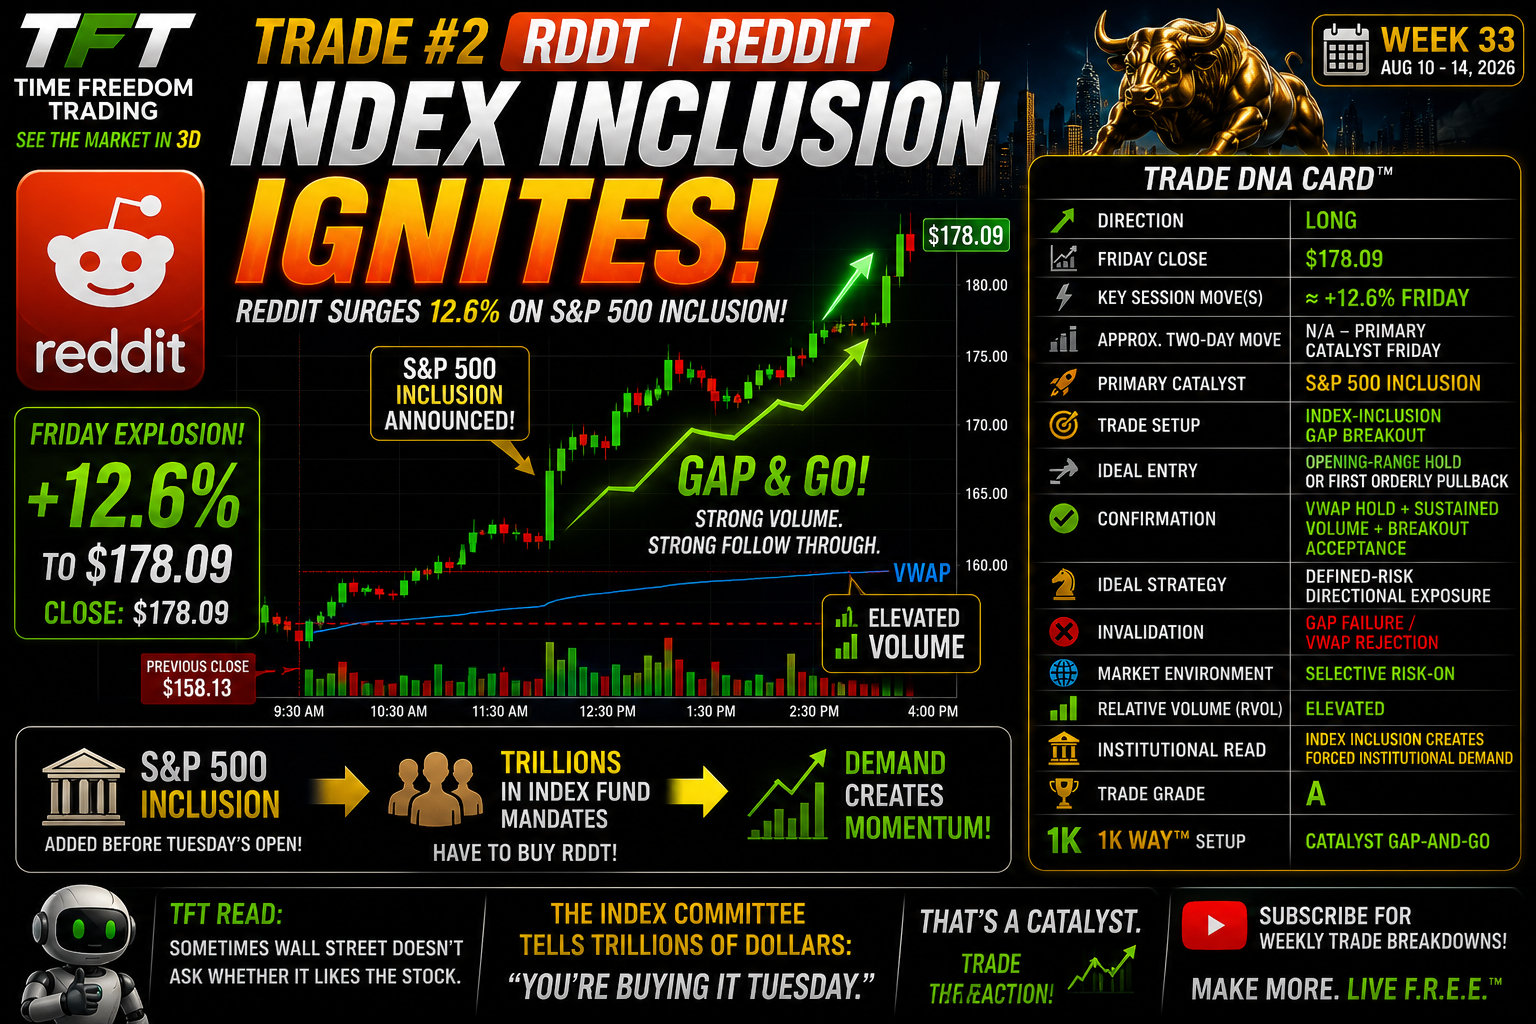
TRADE #2 — RDDT | REDDIT
HOW TO TRADE AN S&P 500 INCLUSION CATALYST
Reddit’s move was not a normal earnings breakout.
It was an index-inclusion catalyst.
Reddit announced on August 14, 2026 that it would join the S&P 500 effective before the market open on Tuesday, August 18. The move was an off-cycle change triggered by the acquisition of an existing S&P 500 constituent.
That matters because the S&P 500 is weighted by float-adjusted market capitalization, and index-tracking funds must adjust their holdings when constituents change.
That creates a very different setup from:
“Reddit had good earnings.”
This catalyst says:
A large pool of institutional capital now has a mechanical reason to own the stock.
That is the edge.
THE CATALYST — FORCED DEMAND
When a company enters the S&P 500, funds designed to replicate the index must incorporate the new constituent.
They are not asking:
“Do we love Reddit?”
They are asking:
“What weight does Reddit now represent in the benchmark?”
That creates implementation demand around the effective date. The broader phenomenon is called the index effect—the price and volume behavior associated with stocks being added to or removed from major indexes. S&P Dow Jones Indices has studied the effect for decades and notes that it has weakened structurally over time as liquidity has improved, which is exactly why traders should treat inclusion as a catalyst—not a guaranteed profit machine.
TRADE DNA CARD™
| Metric | TFT Read |
|---|---|
| Direction | LONG |
| Friday Close | $178.09 |
| Key Session Move(s) | ≈ +12.6% Friday |
| Primary Catalyst | S&P 500 inclusion |
| Trade Setup | Index-Inclusion Gap Breakout |
| Ideal Entry | Opening-range hold or first controlled pullback |
| Confirmation | VWAP hold + sustained volume + breakout acceptance |
| Ideal Strategy | Defined-risk directional exposure |
| Invalidation | Gap failure / sustained VWAP rejection |
| Market Environment | Selective risk-on |
| RVOL | Elevated |
| Institutional Read | Mechanical index demand + event-driven positioning |
| Trade Grade | A |
| 1K WAY™ Setup | Catalyst Gap-and-Go |
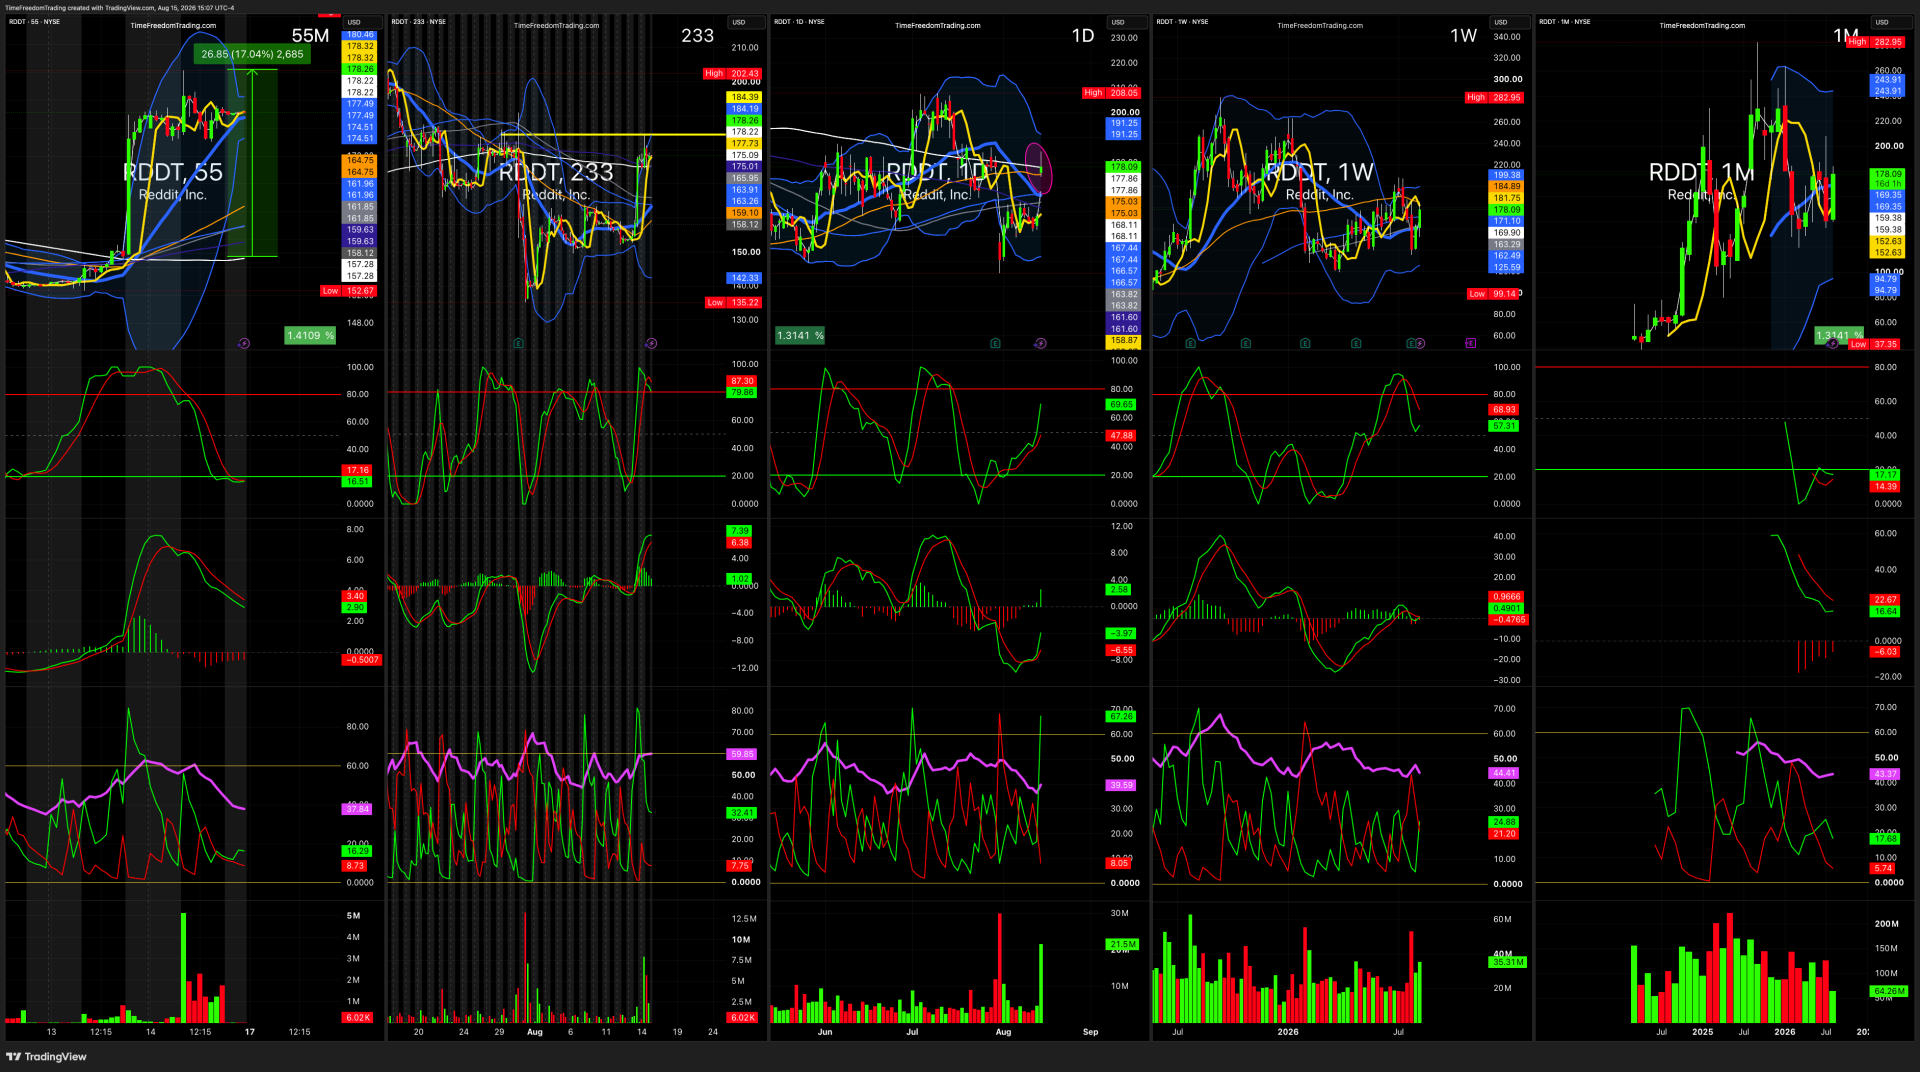
REDDIT — WHAT MADE THE MOVE TRADEABLE?
RDDT surged roughly 12.6% Friday to $178.09 on the inclusion announcement.
The important piece was not simply the percentage gain.
It was the combination:
Fresh catalyst
→ Gap higher
→ Elevated volume
→ Price holds VWAP
→ Opening range holds
→ Breakout accepts higher prices
That sequence tells you institutions are not merely reacting to the headline.
They're accepting the repricing.
THE TFT INDEX-INCLUSION PLAYBOOK™
PHASE 1 — THE ANNOUNCEMENT
The first trade begins when S&P DJI officially announces the addition.
Do not trade rumors.
Use the official S&P announcement or company IR release.
For Reddit, the inclusion was confirmed ahead of the August 18 effective date.
Your first question:
Did price react immediately and violently?
If yes, the market recognizes the catalyst.
If the stock barely moves?
Don't force it.
PHASE 2 — THE GAP
A strong inclusion candidate often gaps higher after the announcement.
Now the trader has a decision:
Chase the gap?
Usually no.
The better trade is often:
- Opening-range hold
- First controlled pullback
- VWAP support
- Reclaim after an early flush
- Breakout through the opening high
The announcement gets the stock on the radar.
Structure gets you into the trade
PHASE 3 — WATCH VOLUME
Volume matters enormously.
An inclusion catalyst should attract:
- Index funds
- ETFs
- Active managers benchmarking the S&P 500
- Event-driven traders
- Arbitrage desks
- Momentum traders
That can create unusually heavy volume.
The exact RVOL multiple matters less than the message:
Is volume materially larger than normal?
If price gaps 10% but volume is weak and the stock loses VWAP, that's a very different trade from a gap that keeps attracting buyers all day.
PHASE 4 — THE EFFECTIVE-DATE TRADE
This is where amateurs make the mistake.
They assume:
“Funds have to buy Tuesday, therefore Reddit must go higher Tuesday.”
No.
The market already knows the effective date.
A large portion of the expected demand may be front-run before inclusion.
That creates three possibilities:
1. Continuation: buyers keep pushing price higher into effective inclusion.
2. Consolidation: price holds the gap while institutions absorb supply.
3. Sell-the-news: traders who bought the announcement unload shares into index-fund demand.
All three are legitimate outcomes.
That's why the effective date is not automatically the entry.
It's another catalyst checkpoint.
WHAT TO WATCH BEFORE THE EFFECTIVE DATE
For a setup like Reddit, mark:
- Announcement-day high
- Announcement-day low
- Gap midpoint
- VWAP
- Prior resistance
- Pre-inclusion high
- Effective date
-
Volume trend.
BULLISH SIGNAL
Price remains above the announcement gap and produces higher lows.
WARNING
Price repeatedly fails at the announcement high.
BEARISH SIGNAL
The stock loses the gap and cannot reclaim VWAP.
That tells you the market has already absorbed the catalyst.
THE BIGGEST TRAP — BUYING TOO LATE
An S&P 500 inclusion sounds like guaranteed buying pressure.
That's exactly why the setup can become dangerous.
Everyone knows index funds must rebalance.
Everyone knows the effective date.
Everyone sees the headline.
So ask:
How much of the catalyst is already in the price?
A stock that jumps 15%, runs another 10%, becomes wildly extended from VWAP, then enters inclusion day is not necessarily a better trade.
It may simply be a more expensive one.
That's where discipline beats FOMO.
THE 1K WAY™ FILTER
Before trading any future S&P 500 addition, ask five questions:
- CATALYST: Is the inclusion officially confirmed?
- MOVE: Did price react strongly enough to matter?
- VOLUME: Did institutional activity expand?
- STRUCTURE: Is the gap holding above VWAP and prior resistance?
- RISK: Where does the thesis become wrong?
If you cannot answer all five, you do not have a trade.
You have a headline.
TFT READ
Reddit teaches a simple lesson:
Index inclusion can create mechanical demand, but mechanical demand does not eliminate market structure.
The announcement creates the opportunity.
The gap creates the battlefield.
Volume tells you whether institutions care.
VWAP tells you whether buyers are defending the repricing.
The effective date creates another decision point.
And discipline determines whether you participate intelligently—or become exit liquidity for everyone who bought the announcement first.
Sometimes Wall Street doesn't ask whether it likes the stock.
The index committee simply tells trillions of dollars:
“You're buying it.”
That's a catalyst.
But remember:
CATALYST CREATES THE MOVE.
STRUCTURE CREATES THE TRADE.
DISCIPLINE KEEPS THE MONEY.
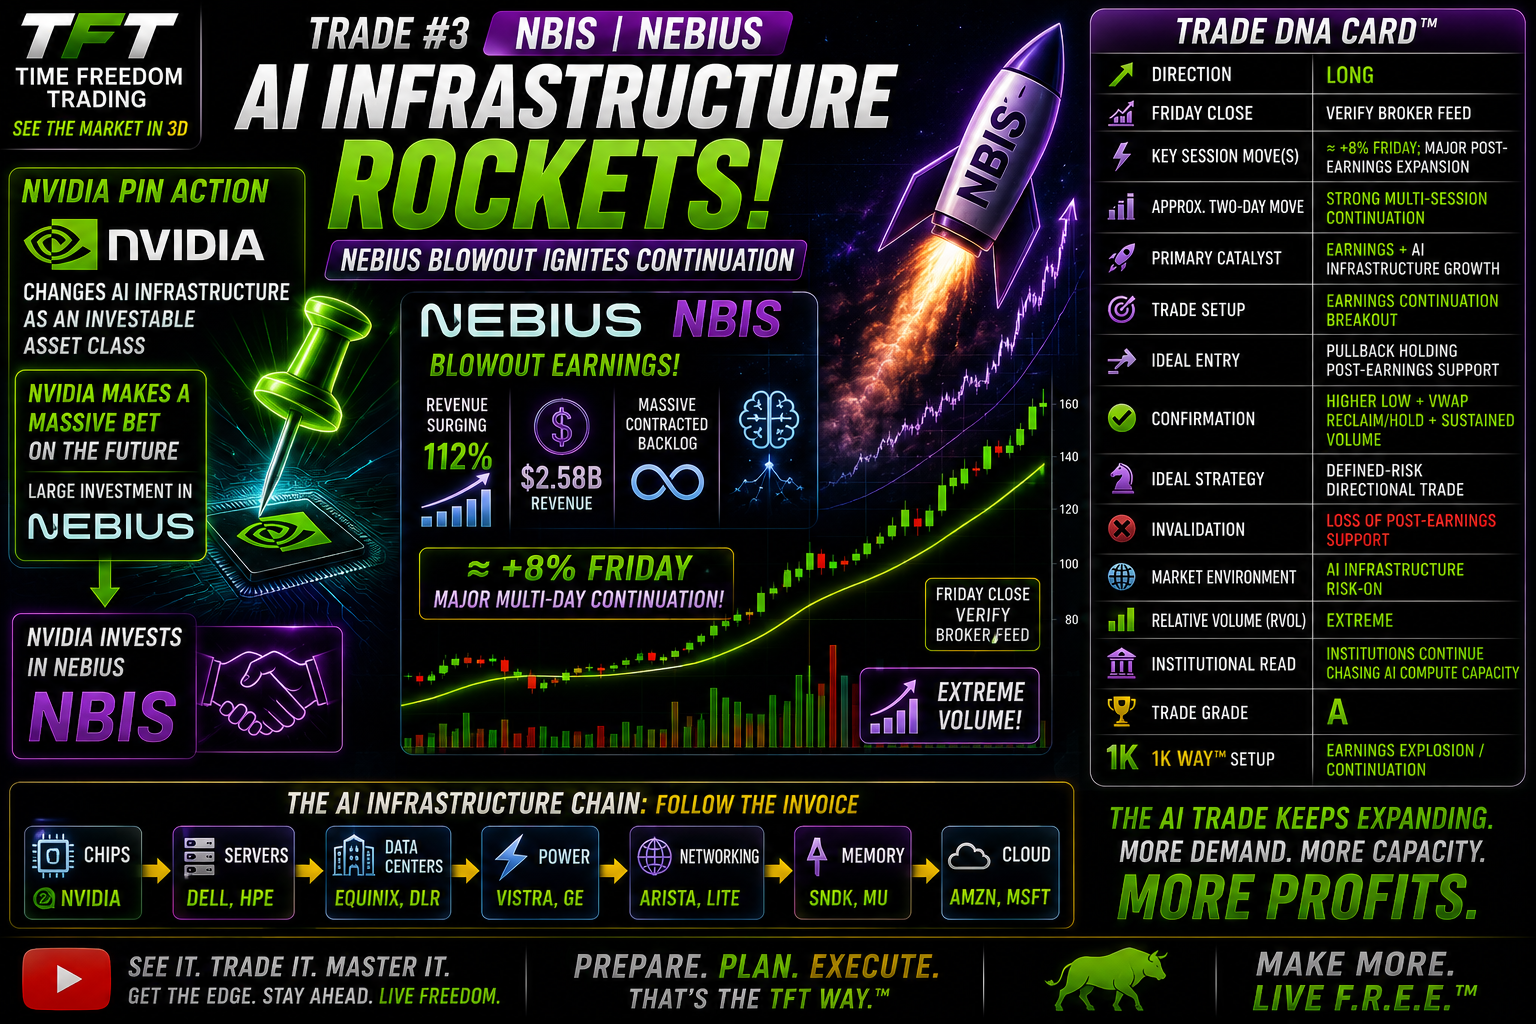
TRADE #3 — NBIS | NEBIUS
THE NVIDIA PIN-ACTION TRADE: AI INFRASTRUCTURE BECOMES AN ASSET CLASS
Nebius wasn't an isolated earnings trade.
It was the culmination of a week-long chain reaction across the AI infrastructure ecosystem.
That's what makes this trade important.
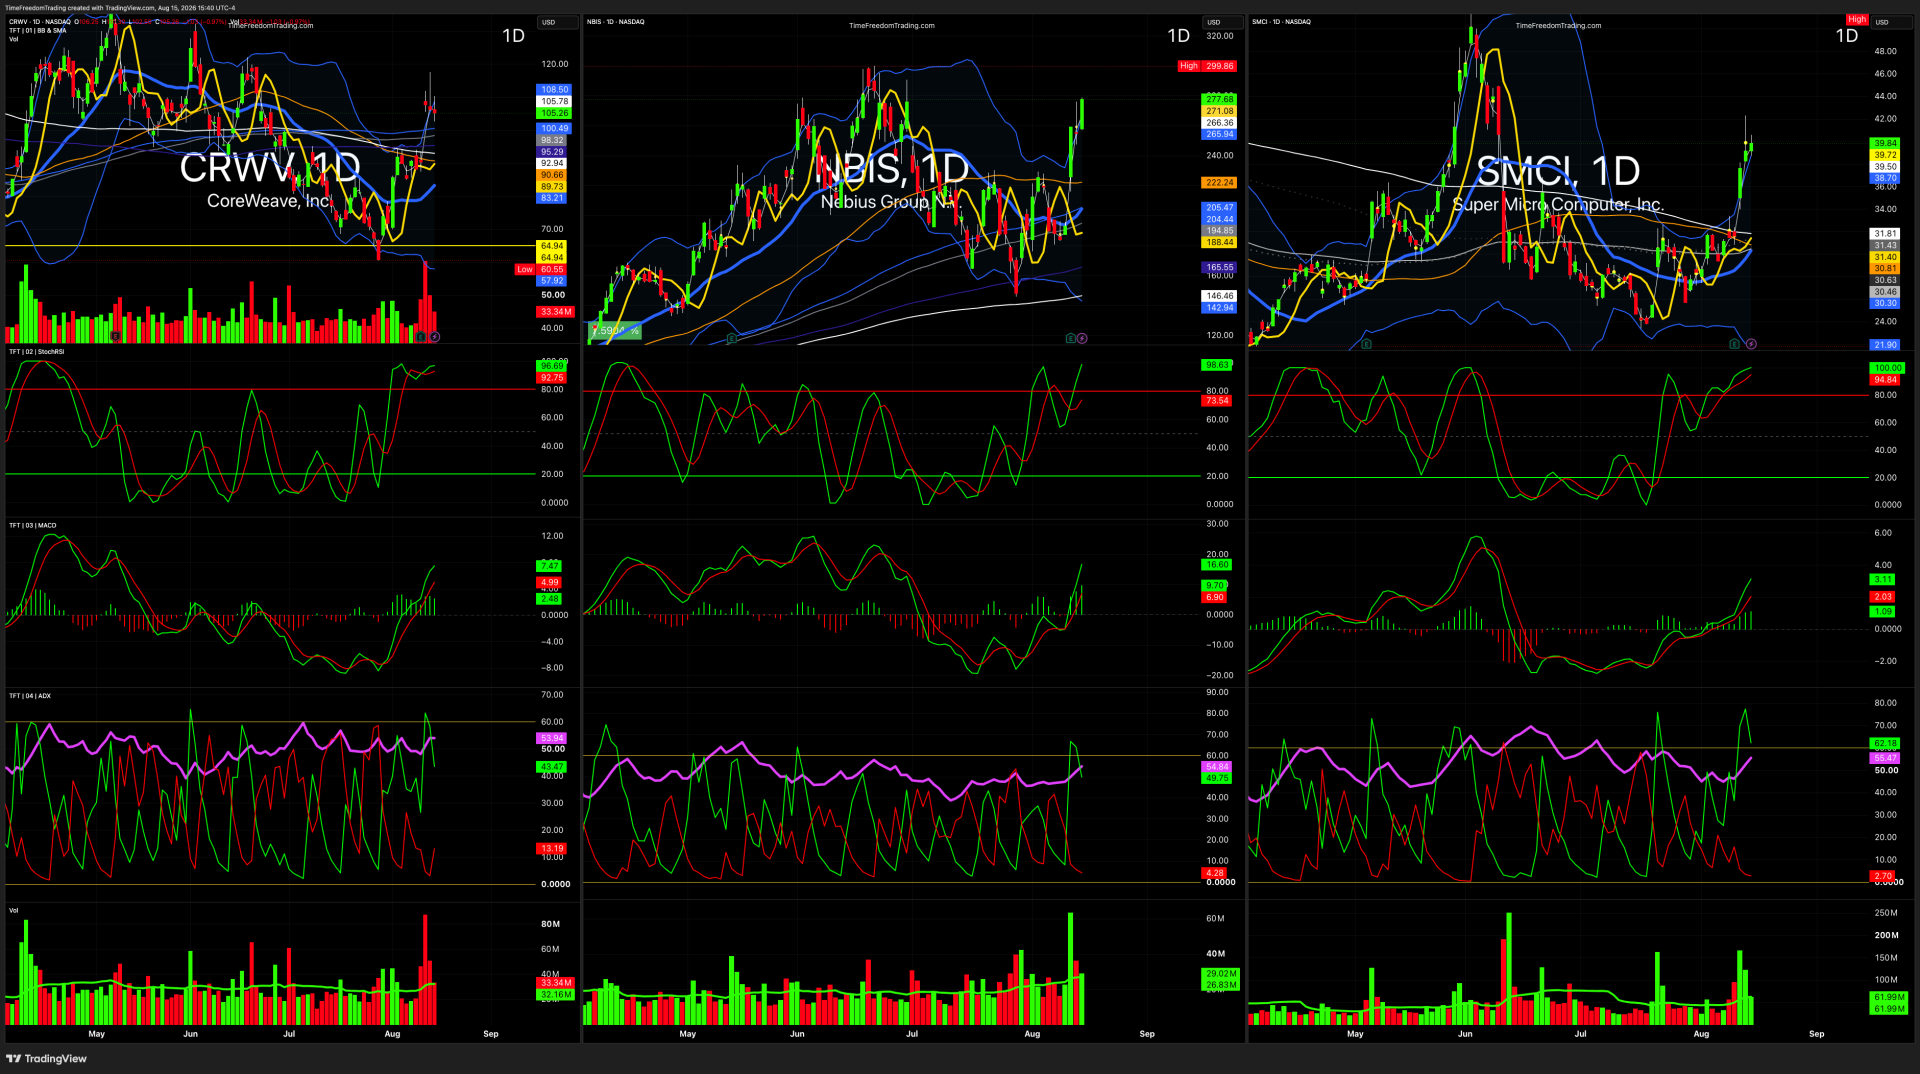
CoreWeave reported explosive demand.
Super Micro confirmed server demand.
Nebius confirmed compute scarcity.
NVIDIA sits at the center of the ecosystem.
Then capital started moving across the entire infrastructure chain.
This is what TFT calls PIN ACTION:
One catalyst validates an investment thesis. Related companies confirm it. Institutional capital then moves through the ecosystem looking for the next beneficiary.
The trade wasn't simply NBIS.
The trade was recognizing that Wall Street was beginning to treat AI infrastructure itself as an investable asset class.
CATALYST #1
— NVIDIA CHANGES THE CONVERSATION
Earlier in the week, NVIDIA was part of a major financing push seeking more than $500 billion of third-party capital for AI infrastructure, according to Reuters.
That's significant.
The AI conversation is evolving beyond:
Who makes the best GPU?
Toward:
Who finances, builds, powers, connects and operates the infrastructure required to deploy those GPUs?
That's a major shift.
Think about the capital chain:
NVIDIA GPUs
↓
AI Servers
↓
Neocloud Compute
↓
Data Centers
↓
Networking
↓
Memory
↓
Power + Cooling
NVIDIA is effectively the gravitational center.
But billions of dollars orbit that center.
That's where the pin action begins.
CATALYST #2
— COREWEAVE FIRES THE STARTING GUN
Then CoreWeave reported.
And Wall Street got its first major receipt.
Q2 revenue more than doubled to approximately $2.58 billion.
But the bigger number was sitting in the backlog.
$104.2 BILLION.
CoreWeave also said it had secured more than $25 billion in new customer commitments during the current quarter and raised its 2026 capital-spending forecast to $35–$39 billion.
Management said its near-term capacity was effectively sold out.
Shares surged more than 19% during Wednesday's session.
Read that again:
CAPACITY EFFECTIVELY SOLD OUT.
That's the key to the entire trade.
Wall Street wasn't merely seeing strong AI demand.
It was seeing scarcity of AI compute capacity.
Scarcity creates pricing power.
Pricing power creates margins.
Margins create earnings.
Earnings attract capital.
Suddenly the question became:
Who else owns AI compute capacity?
Hello, Nebius.
CATALYST #3
— SUPERMICRO CONFIRMS THE HARDWARE DEMAND
Then Super Micro added another piece of evidence.
SMCI forecast fiscal 2027 revenue of approximately $65–$72 billion, dramatically above Wall Street's roughly $52.5 billion consensus estimate.
The company's quarterly revenue nearly doubled to $11.12 billion.
More importantly, management pointed toward continued demand for AI-optimized servers and improving margins.
Shares jumped sharply, climbing more than 13% during Wednesday trading.
Now Wall Street had two signals:
CoreWeave: Compute demand remains enormous.
Super Micro: Hardware demand remains enormous.
That matters because confirmation across adjacent industries increases confidence that we're seeing a capital cycle, not one company's lucky quarter.
CATALYST #4
— NEBIUS DROPS THE RECEIPT
Then came Nebius.
And this is where the trade went from interesting to explosive.
Nebius reported Q2 revenue of approximately $582.3 million, ahead of expectations.
Its core AI cloud business grew nearly sixfold.
But again, the most important numbers weren't simply the quarterly numbers.
Nebius signed four AI cloud contracts averaging more than $1 billion each.
Total contract value nearly quadrupled.
New-customer contract value increased more than ninefold.
And management said demand remained sufficiently strong that it believed it could sell all of its planned 2027 capacity at current terms.
There it is again:
CAPACITY SCARCITY.
CoreWeave says capacity is effectively sold out.
Nebius says it could sell its planned 2027 capacity.
Different company.
Same message.
That's confirmation.
THE PIN ACTION EXPLODES
Once those earnings hit, institutions didn't limit themselves to NBIS.
The entire ecosystem moved.
On Wednesday:
NBIS: surged roughly 34%.
CRWV: gained approximately 19%.
SMCI: jumped roughly 19%.
DELL: gained about 5%.
IREN: advanced approximately 8%.
APLD: gained roughly 4%.
Even upstream beneficiaries participated:
NVDA: +3%.
MU: +4.9%.
The Philadelphia Semiconductor Index rose approximately 2.5%.
That's not coincidence.
That's institutional pin action.
SEE THE MARKET IN 3D™
This is why looking only at NBIS misses the larger trade.
DIMENSION 1 — STOCK
NBIS earnings beat.
Price explodes.
Easy enough.
DIMENSION 2 — INDUSTRY
CRWV confirms AI cloud demand.
SMCI confirms server demand.
DELL participates.
Data-center names participate.
Semiconductors participate.
Now we have industry confirmation.
DIMENSION 3 — CAPITAL CYCLE
NVIDIA GPUs require infrastructure.
Infrastructure requires financing.
Financing builds data centers.
Data centers buy servers.
Servers consume GPUs.
GPUs require memory.
Everything requires networking, electricity and cooling.
Now we're no longer looking at one earnings report.
We're looking at a capital expenditure ecosystem.
That's the 3D view.
FOLLOW THE INVOICE™
Here's the money trail:
NVIDIA — CHIPS
↓
SMCI / DELL — SERVERS
↓
CRWV / NBIS — COMPUTE CAPACITY
↓
VRT — COOLING + POWER INFRASTRUCTURE
↓
ANET / LITE — NETWORKING + OPTICS
↓
MU / SNDK — MEMORY + STORAGE
↓
VST / CEG — POWER
Every layer sends an invoice to the next layer.
And somebody collects the money.
That's why the better question isn't:
“What's the next NVIDIA?”
It's:
“Where does NVIDIA's success force money to be spent next?”
That's a substantially more powerful way to think about the AI trade.
THE NBIS TRADE
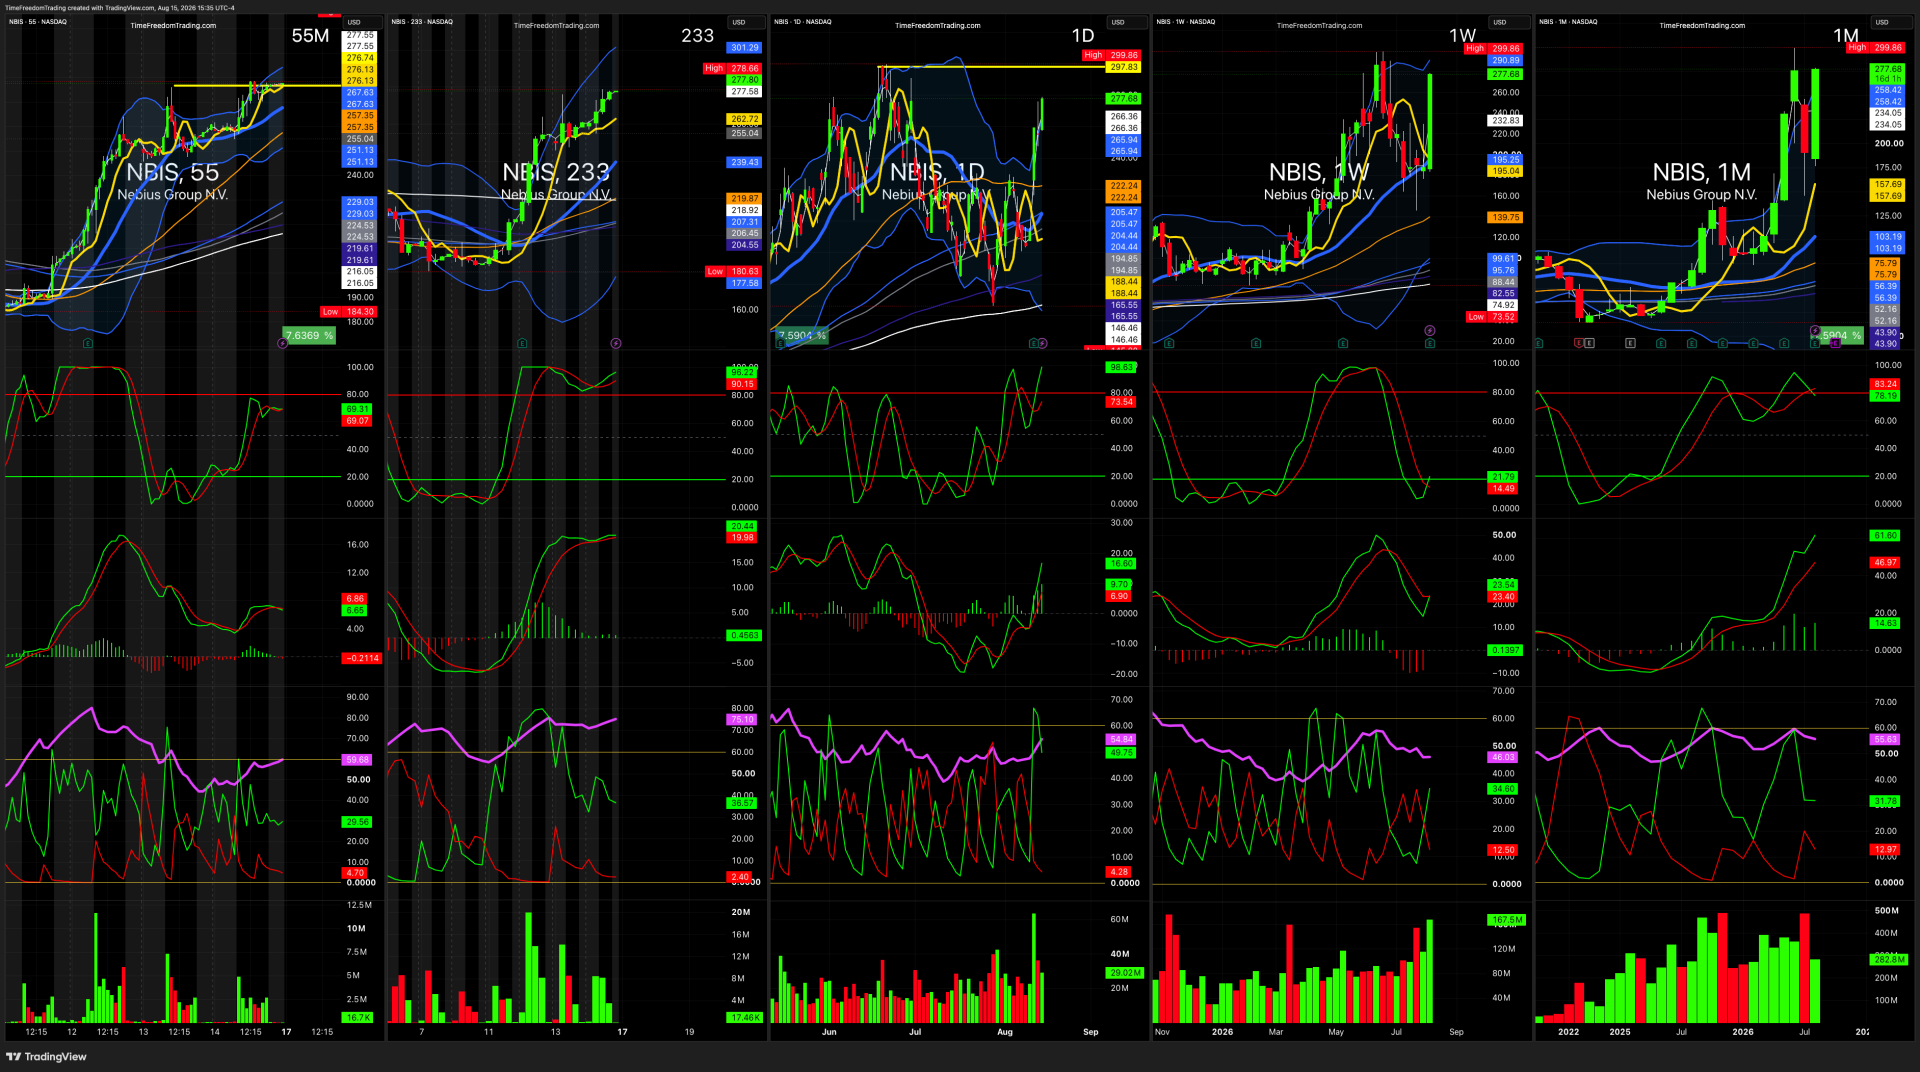
NBIS gave traders the cleanest expression of this thesis because the catalyst and industry confirmation arrived together.
The sequence was:
NVIDIA infrastructure financing narrative
↓
CRWV blows out earnings
↓
CRWV says compute capacity is effectively sold out
↓
SMCI confirms enormous server demand
↓
NBIS reports
↓
AI cloud revenue nearly 6X
↓
Four $1B+ average contracts
↓
2027 capacity demand confirmed
↓
NBIS EXPLODES
And crucially, the move didn't immediately disappear.
The stock produced multi-session continuation, with additional strength into Friday.
That's where the second trade appears.
DON'T CHASE THE FIRST CANDLE
The first earnings candle tells you something happened.
It doesn't automatically give you a good entry.
After a 20%, 30% or larger gap, the risk/reward can become terrible very quickly.
Instead, look for:
Gap support.
VWAP acceptance.
Higher lows.
Opening-range breakout.
Elevated RVOL.
Industry confirmation.
Then look for the controlled pullback.
The first move establishes the new valuation.
The second move can confirm institutional conviction.
That's where continuation traders should become interested.
TRADE DNA CARD™
| Metric | TFT Read |
|---|---|
| Direction | LONG |
| Key Session Move(s) | Massive earnings breakout + multi-session continuation |
| Primary Catalyst | Earnings + exploding AI compute demand |
| Secondary Catalyst | CRWV + SMCI earnings confirmation / NVIDIA infrastructure pin action |
| Industry Catalyst | AI compute demand continues exceeding available capacity |
| Trade Setup | Earnings Explosion → Pullback → Continuation |
| Ideal Entry | First controlled pullback holding post-earnings support |
| Confirmation | Higher low + VWAP hold/reclaim + sustained RVOL + peer confirmation |
| Ideal Strategy | Shares or defined-risk directional exposure after confirmation |
| Invalidation | Loss of post-earnings support / failed gap |
| Market Environment | AI infrastructure risk-on |
| RVOL | Extreme |
| Institutional Read | Capital aggressively repricing scarce AI compute capacity |
| Trade Grade | A+ |
| 1K WAY™ Setup | Earnings Explosion + Pin Action + Trend Continuation |
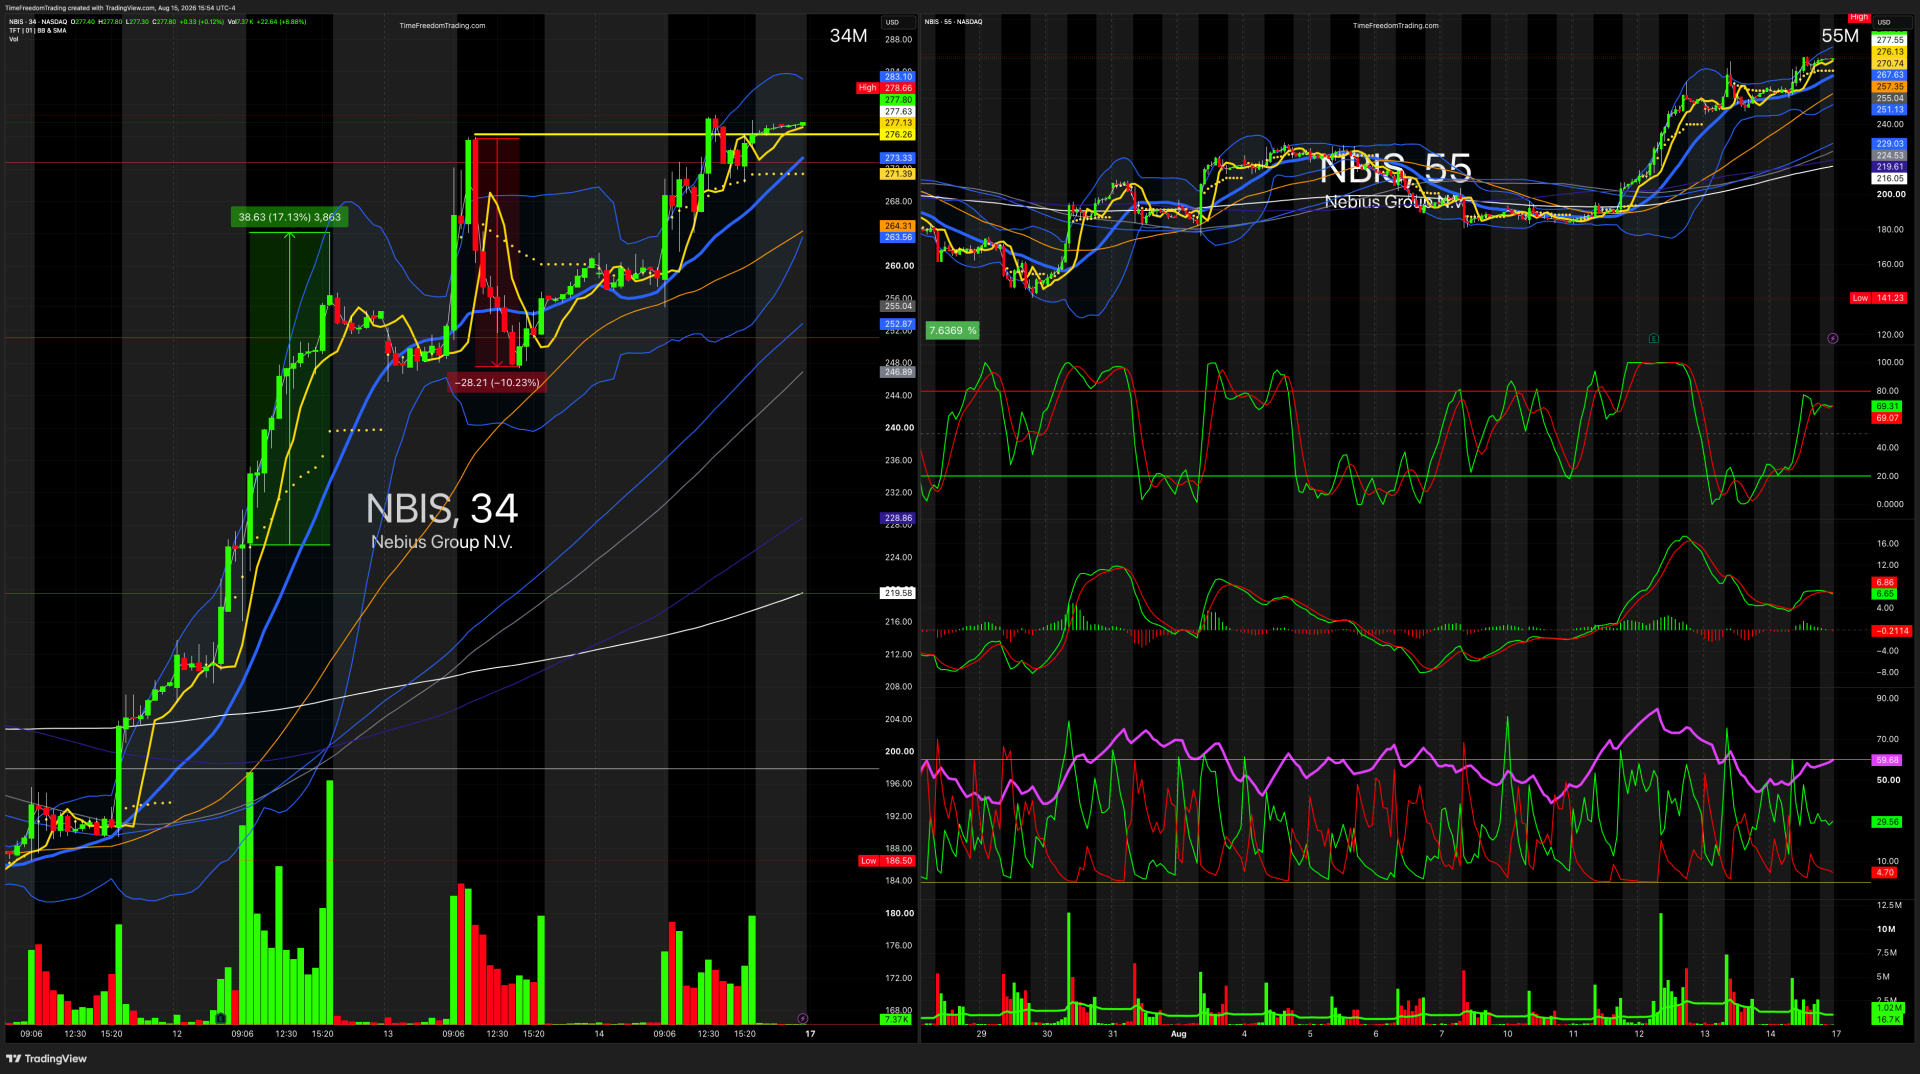
ART IN THE CHART™
The chart gives us the trade.
But the ecosystem gives us conviction.
When NBIS rises alone, investigate.
When NBIS, CRWV, SMCI, DELL, IREN, APLD, NVDA and MU begin moving together after multiple companies report accelerating AI infrastructure demand?
Pay attention.
One stock can lie.
One earnings reaction can be noise.
But when capital moves simultaneously across several layers of the same economic ecosystem, institutions may be telling you something much bigger:
THE MONEY IS ROTATING INTO THE THEME.
TFT READ — FOLLOW THE INVOICE
This week's AI earnings delivered a major lesson.
The AI trade is no longer simply:
Buy NVIDIA.
The infrastructure required to turn NVIDIA's chips into usable intelligence has become an enormous economic ecosystem of its own.
CoreWeave confirmed demand.
Super Micro confirmed hardware.
Nebius confirmed compute scarcity.
The stocks confirmed each other.
That's PIN ACTION.
And that's how traders should begin thinking about AI.
Don't merely ask:
Who's making the chip?
Ask:
Who's building the server?
Who's operating the data center?
Who's providing the compute?
Who's supplying memory?
Who's moving the data?
Who's cooling the rack?
Who's generating the electricity?
Because the AI gold rush isn't one company anymore.
It's an infrastructure buildout.
And when trillions of dollars start building infrastructure, somebody gets paid at every stop.
FOLLOW THE CATALYST.
FOLLOW THE PIN ACTION.
FOLLOW THE INVOICE.
TRADE #4
— AMAT | APPLIED MATERIALS
THE PRE-EARNINGS FADE + POST-EARNINGS DEAD-CAT BOUNCE
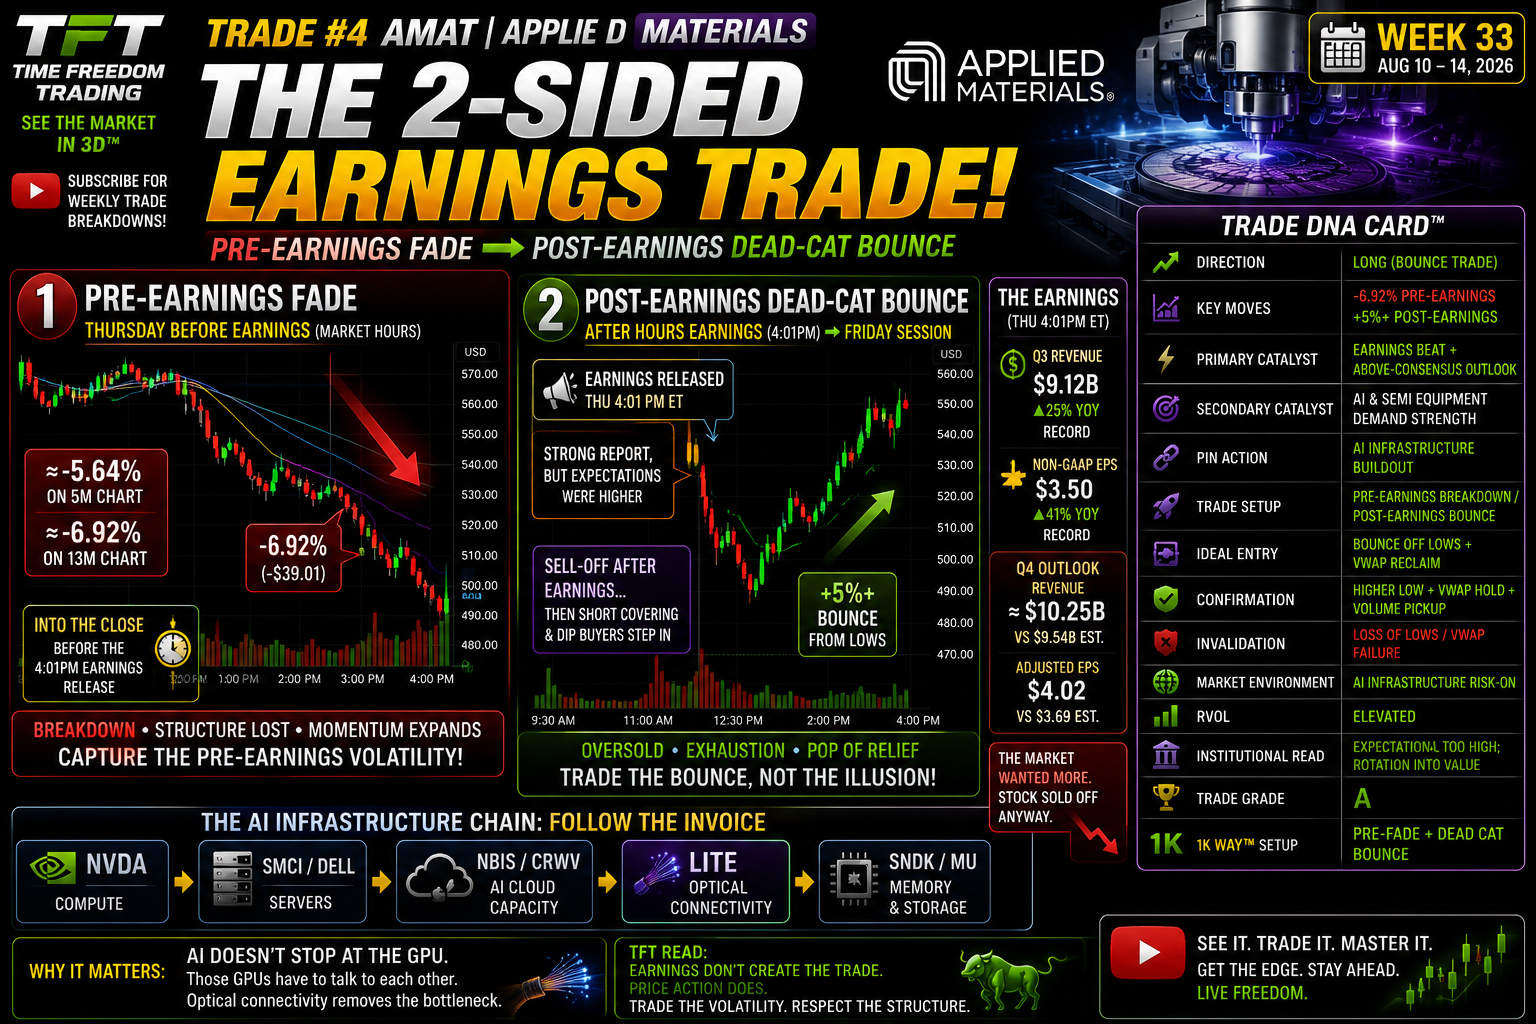
AMAT gave us a textbook lesson in why earnings volatility can begin before earnings are actually released.
The company didn't report until 4:01 PM ET Thursday, August 13. Applied Materials ultimately delivered record Q3 revenue of $9.12 billion, up 25% year over year, with record non-GAAP EPS of $3.50. It also guided Q4 revenue to roughly $10.25 billion, above Wall Street's $9.54 billion consensus.
Sounds bullish.
The stock didn't care.
And that's exactly why this trade belongs in the Weekend Report.
MOVE #1 — THE MARKET MOVED BEFORE THE NEWS
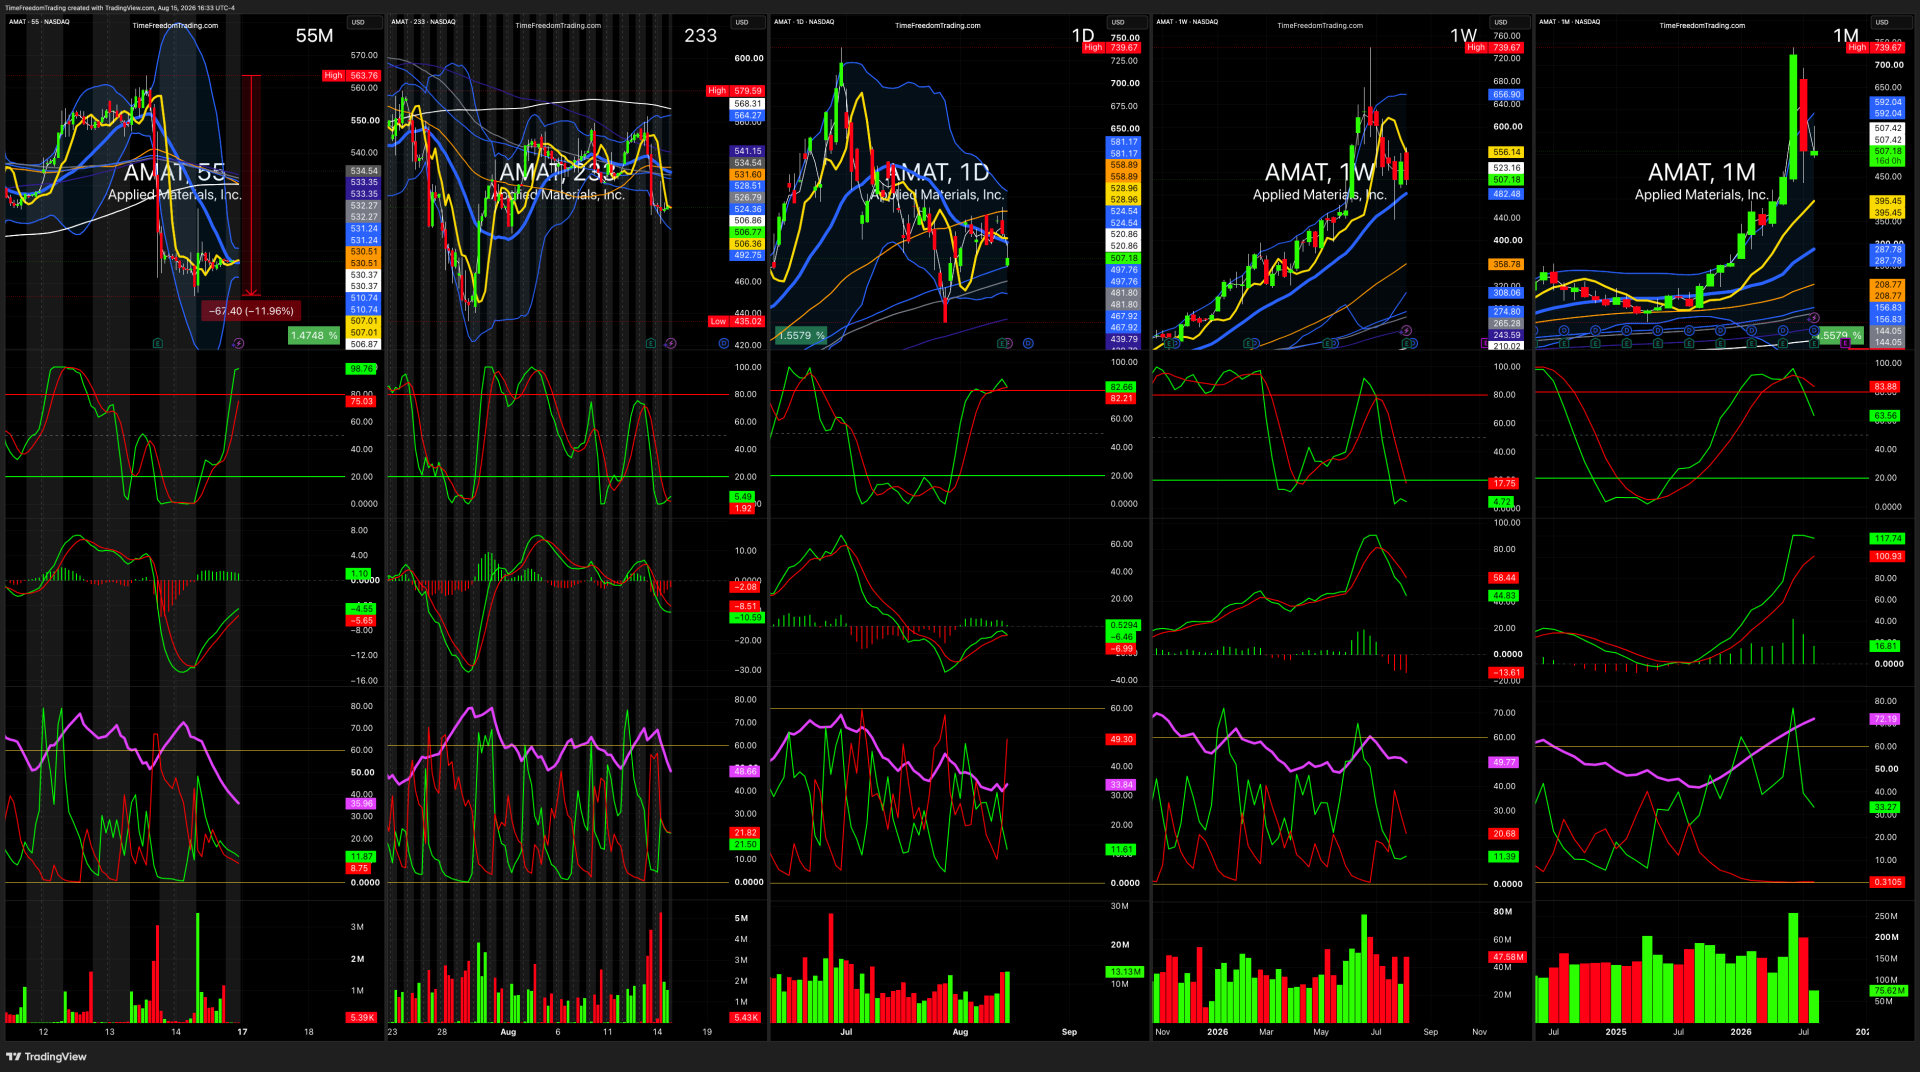
Your intraday charts show AMAT weakening aggressively into Thursday's closing bell before the 4:01 PM earnings release.
On the 5-minute chart, the measured move is approximately:
−5.64% / −$31.79
The 13-minute view shows an even larger measured swing of roughly:
−6.92% / −$39.01
That's important.
The actual earnings hadn't been released yet.
But price was already changing character.
AMAT rolled over from the mid-$550s, broke its intraday structure, lost multiple moving averages and accelerated lower into the close.
That is a critical TFT lesson:
The earnings trade doesn't necessarily begin when the earnings press release hits.
Positioning happens before the announcement.
Traders reduce risk.
Options dealers hedge.
Institutions reposition.
Short-term traders front-run expected volatility.
The result can be a significant pre-earnings volatility trade without ever holding through the binary event.
TRADE DNA CARD™
| Metric | TFT Read |
|---|---|
| Direction | SHORT → TACTICAL REVERSAL LONG |
| Pre-Earnings Move | ≈ −5.64% measured on 5M / −6.92% on 13M chart |
| Post-Earnings Trade | 5%+ dead-cat bounce from lows |
| Primary Catalyst | Q3 earnings + Q4 outlook |
| Actual Q3 Revenue | $9.12B / +25% YoY |
| Non-GAAP EPS | $3.50 / +41% YoY |
| Q4 Revenue Outlook | ≈ $10.25B |
| Initial Setup | Pre-earnings momentum breakdown |
| Second Setup | Oversold post-earnings dead-cat bounce |
| Ideal Short Entry | Loss of intraday support + failed VWAP/MA reclaim |
| Ideal Bounce Entry | Selling exhaustion + higher low + short-term reclaim |
| Confirmation — Short | Lower highs + expanding downside volume |
| Confirmation — Bounce | Failed breakdown + volume + momentum reversal |
| Invalidation — Short | Reclaim of breakdown structure |
| Invalidation — Long | Loss of post-earnings reaction low |
| Market Environment | Selective semiconductor punishment |
| Institutional Read | Strong fundamentals failed to clear extremely elevated expectations |
| Trade Grade | A |
| 1K WAY™ Setup | Pre-Earnings Fade → Earnings Breakdown → Dead-Cat Bounce |
THE BETTER WAY TO TRADE EARNINGS
Most traders think the earnings decision is binary:
Buy calls before earnings.
Or:
Buy puts before earnings.
Then pray harder than their option premium deserves.
AMAT shows another approach.
Trade the volatility around earnings rather than gambling through earnings.
Thursday's pre-close breakdown offered a directional move exceeding 5% while the market was still open.
That meant a trader could potentially participate in the volatility and still be flat before the binary announcement.
That's a completely different risk profile.
You're trading price behavior, not guessing what Gary Dickerson is about to say on an earnings call.
THEN THE NUMBERS ARRIVED
Here's where AMAT became even more interesting.
The quarter itself was strong.
Revenue hit a record $9.12 billion.
Non-GAAP EPS reached a record $3.50, up 41% year over year.
Management said AI adoption was creating unprecedented demand for its materials-engineering solutions and raised expectations for parts of its semiconductor business.
Q4 guidance was also above consensus: approximately $10.25 billion revenue and $4.02 adjusted EPS, versus analyst estimates around $9.54 billion and $3.69 respectively.
And AMAT still sold off.
Why?
EXPECTATIONS.
The market had already priced in something closer to perfection.
Reuters reported investors were concerned that Applied's growth wasn't accelerating as rapidly as some semiconductor-equipment peers. The stock ultimately lost 5.1% Friday despite the apparently strong forecast.
That's the difference between:
Good earnings
and
Good enough earnings.
Wall Street grades on a curve.
And apparently it's the kind of professor who gives you a 94 and asks where the other six points went.
MOVE #2 — THE DEAD-CAT BOUNCE
This is where the second volatility trade developed.
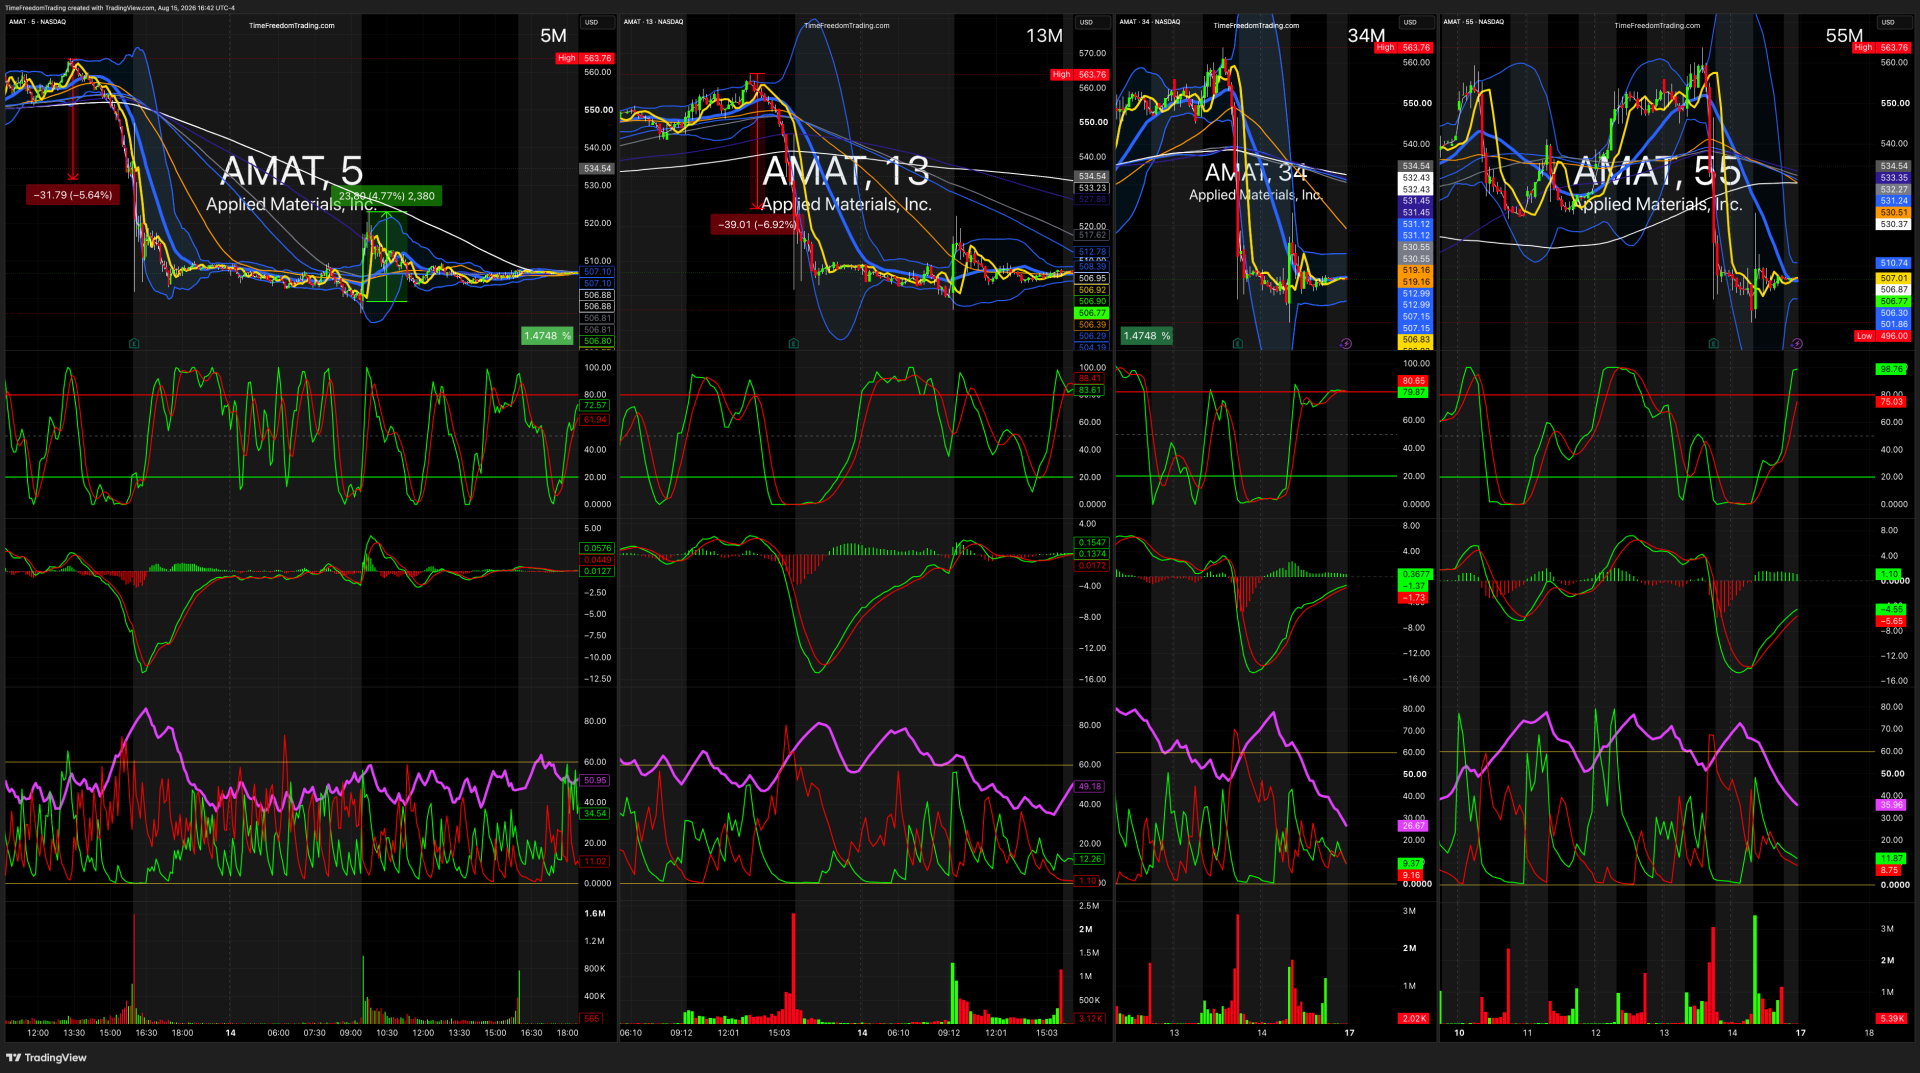
After the initial earnings repricing and sharp selloff, AMAT became heavily extended to the downside.
Your intraday charts then show a sharp relief rally from the post-earnings lows.
The rebound exceeded 5% from the low, before failing to repair the larger bearish structure.
That's important.
A stock can remain fundamentally bearish and still produce a violent bullish trade.
This is the classic:
DEAD-CAT BOUNCE
The stock gets hammered.
Shorts take profits.
Dip buyers arrive.
Oversold momentum unwinds.
Price reclaims short-term levels.
Momentum traders pile into the bounce.
Suddenly the stock rallies 5%+.
But here's the distinction:
A bounce is not automatically a reversal.
The higher timeframe remained damaged.
AMAT still had overhead resistance.
The earnings gap remained unresolved.
So the bounce became a trade, not necessarily a new bullish thesis.
Want to learn more.... read here →
THE TWO-SIDED AMAT TRADE
That's what makes this setup valuable for TFT.
There were effectively two separate volatility opportunities surrounding one earnings event:
PRE-EARNINGS
Price loses structure
↓
Momentum accelerates
↓
Volume expands
↓
≈ −5.6% TO −6.9% DOWNSIDE MOVE
Then earnings arrive after the close.
POST-EARNINGS
Expectations disappoint
↓
Stock reprices lower
↓
Selling becomes extended
↓
Shorts cover + dip buyers arrive
↓
5%+ DEAD-CAT BOUNCE
Same ticker.
Same catalyst window.
Two directions.
And critically:
Neither trade required predicting the earnings number.
ART IN THE CHART™
The lesson isn't:
“AMAT earnings were bad.”
They weren't.
The lesson is that price and fundamentals can tell different stories because expectations sit between them.
And the charts gave traders information before and after the binary event.
BEFORE EARNINGS:
Price > prediction.
You didn't need to know the earnings numbers to trade the breakdown.
AFTER EARNINGS:
Reaction > report.
You didn't need to believe AMAT suddenly became a great value to trade the oversold bounce.
That's sophisticated earnings trading.
You're separating the company from the trade.
TFT READ — TRADE THE VOLATILITY, NOT THE LOTTERY TICKET
AMAT may be the most educational trade of the five.
Why?
Because you could have captured 5%+ volatility on both sides of the earnings event without needing to make the classic amateur bet:
“I think they're going to beat tonight.”
They did beat.
The stock fell anyway.
That's your lesson.
Don't predict the report.
Trade the reaction.
Don't assume a selloff travels in a straight line.
Trade the exhaustion.
And don't mistake a dead-cat bounce for a new bull market just because the cat suddenly discovered a trampoline.
PRE-EARNINGS: TRADE THE POSITIONING.
POST-EARNINGS: TRADE THE REACTION.
NEVER CONFUSE A 5% BOUNCE WITH A CHANGED THESIS.
That's how you turn earnings from a roulette wheel into a volatility framework.

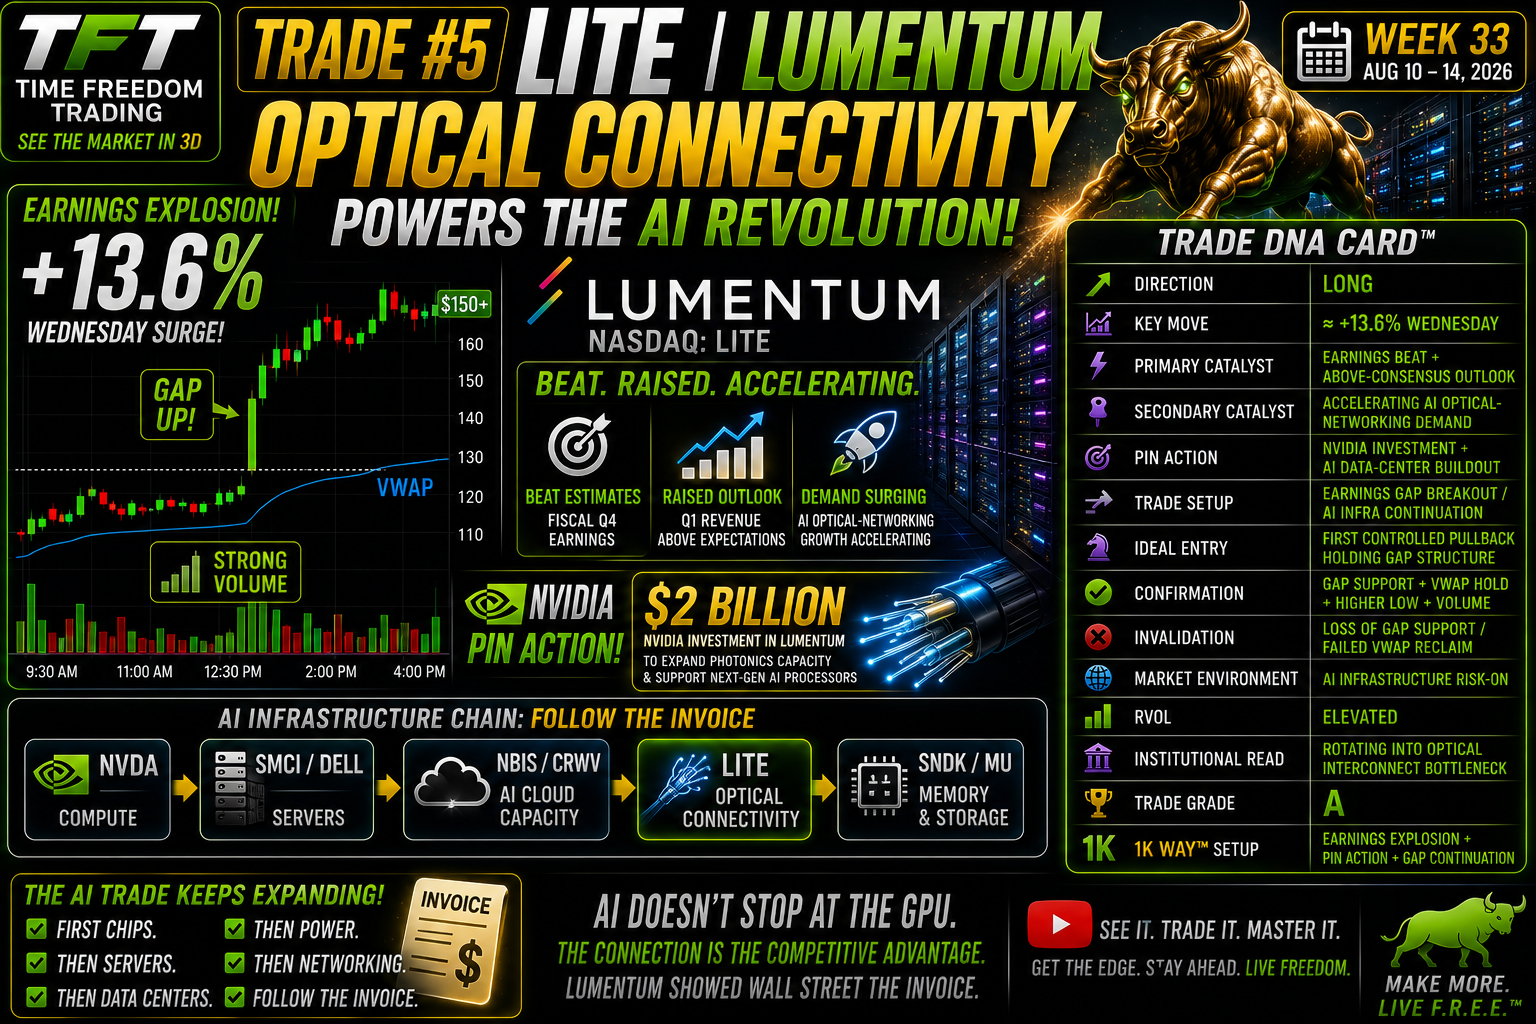
TRADE #5 — LITE | LUMENTUM
THE EARNINGS WHIPSAW THAT BECAME AN AI INFRASTRUCTURE TRADE
Lumentum gave traders one of the best lessons of Week 33 because the trade wasn't simply “earnings beat → stock goes up.”
It was a two-sided post-earnings battle.
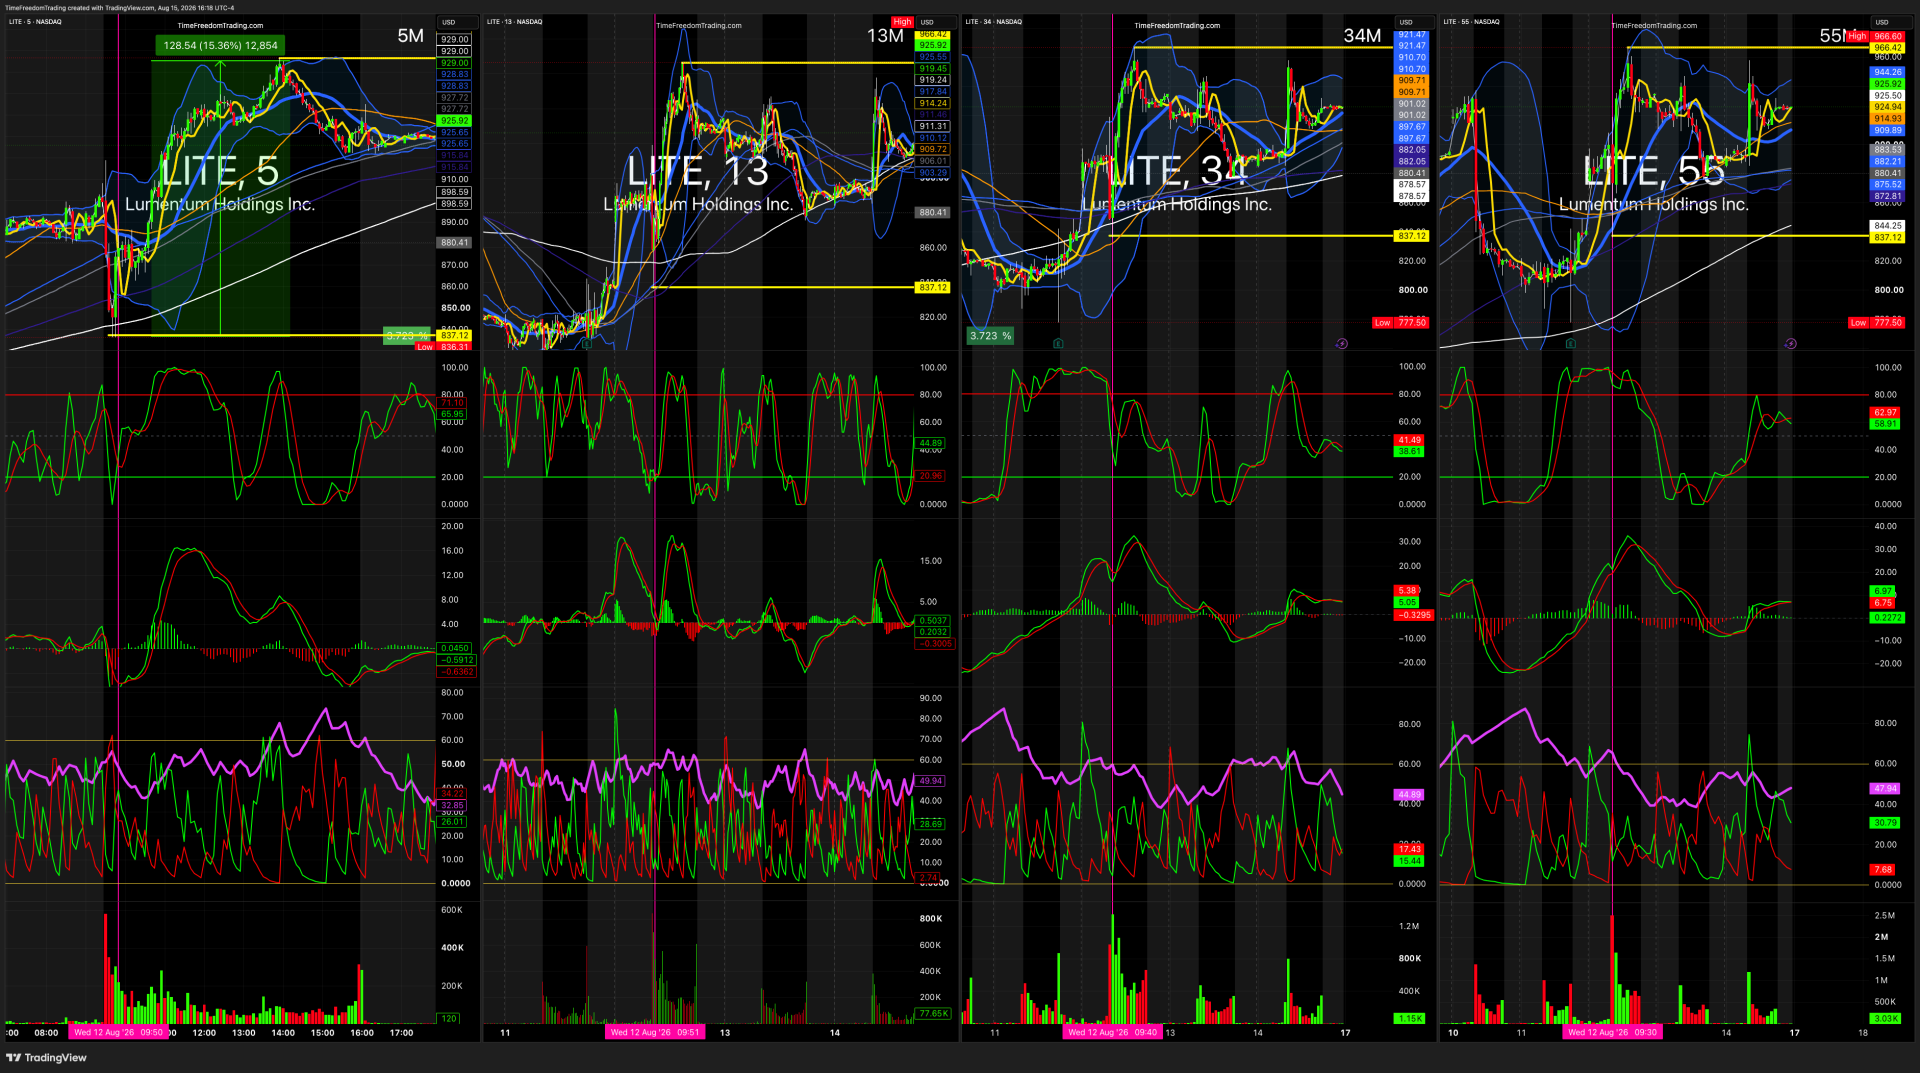
Your charts show LITE initially suffered an approximately −16.1% post-earnings flush, falling roughly $150.75 from the pre-reaction area into a low near $837.
Then the character of the trade changed.
Buyers absorbed the selloff. LITE reclaimed key intraday structure and exploded approximately +15.4% from the reversal area, a roughly $128.54 rebound, before continuing to stabilize higher.
That creates the real lesson:
The first earnings reaction wasn't the trade. The rejection of that reaction was.
TRADE DNA CARD™
| Metric | TFT Read |
|---|---|
| Direction | SHORT → REVERSAL LONG |
| Initial Earnings Move | ≈ −16.1% |
| Measured Decline | ≈ −$150.75 |
| Reversal Low | ≈ $837 zone |
| Rebound From Low | ≈ +15.4% / +$128.54 |
| Primary Catalyst | Earnings + forward outlook |
| Secondary Catalyst | Accelerating AI optical-networking demand |
| Pin Action | NVIDIA investment + AI infrastructure buildout |
| Initial Setup | Earnings breakdown / momentum flush |
| Second Setup | Exhaustion reversal + reclaim |
| Ideal Short Entry | Failed bounce / VWAP rejection following initial breakdown |
| Ideal Long Entry | Failed breakdown followed by higher low and structural reclaim |
| Confirmation | Volume + VWAP reclaim + higher low + peer strength |
| Invalidation — Long | Loss of reversal low / renewed acceptance beneath support |
| Market Environment | AI infrastructure leadership |
| Institutional Read | Initial repricing followed by aggressive absorption of weakness |
| Trade Grade | A |
| 1K WAY™ Setup | Earnings Fade → Wild Horse Reversal → Catalyst Continuation |
WHAT HAPPENED?
Lumentum's earnings gave investors plenty to digest.
The company delivered strong results and an outlook supported by accelerating demand for optical technology tied to AI data centers.
But the first reaction was violent.
MOVE #1 — THE FLUSH: ≈ −16.1%
Instead of immediately rewarding the report, traders aggressively sold LITE.
Your intraday chart captures the move:
Pre-reaction area: roughly $937–$940
Flush low: approximately $837
Measured decline: approximately −16.1%
That's a serious move.
And it's exactly why trading earnings based solely on whether a company "beat" or "missed" is dangerous.
The market doesn't trade the press release.
It trades expectations versus reality.
THEN SOMETHING IMPORTANT HAPPENED
LITE didn't continue collapsing.
It rejected the lows.
Selling pressure became exhausted, buyers appeared, and price started reclaiming structure.
Now we had a completely different setup.
The question changed from:
“How bad can LITE get?”
to:
“What happens if institutions think this selloff was wrong?”
That's where the opportunity emerged.
MOVE #2 — THE REVERSAL: ≈ +15.4%
From approximately the $837 reversal zone, your chart shows LITE rallying roughly $128.54, or about +15.36%.
Think about that range.
≈ −16.1% DOWN
followed by
≈ +15.4% UP FROM THE LOW
That's roughly a $279 total two-way trading range across the earnings reaction and reversal.
That isn't noise.
That's price discovery with a flamethrower.
And it gave traders opportunities in both directions.
THE TFT TRADE — TRADE THE REACTION, NOT THE REPORT
This is exactly why TFT focuses on what price does after the catalyst.
The initial downside move offered the first setup:
Earnings reaction
→ Support breaks
→ VWAP rejection
→ Momentum expands lower
That's the bearish trade.
But once the decline became extended, you don't marry the short thesis.
You watch what happens next.
Then came:
Selling exhaustion
→ Low established around $837
→ Failed continuation lower
→ Higher low
→ VWAP / structure reclaim
→ Momentum reverses
→ +15% rebound
That's the bullish trade.
Same stock.
Same catalyst.
Two completely different trades.
That's seeing the market in 3D
WHY DID BUYERS COME BACK?
This is where the fundamental story becomes important.
Lumentum isn't merely another technology company selling components.
It sits inside one of the emerging bottlenecks of the AI infrastructure buildout:
OPTICAL CONNECTIVITY.
GPUs can calculate at extraordinary speeds.
But those GPUs need to communicate across racks, clusters and data centers.
More compute creates more data.
More data creates more networking demand.
More networking demand creates demand for faster optical interconnects.
And Lumentum sells directly into that problem.
The significance becomes even greater when you consider NVIDIA committed $2 billion to Lumentum earlier in 2026 as part of an effort to expand U.S. photonics manufacturing capacity for next-generation AI infrastructure.
That's not somebody on Reddit saying optics might be important.
That's the company sitting at the center of the AI revolution putting billions behind the thesis
THE NVIDIA PIN ACTION™
Here's where LITE fits into the larger Week 33 story.
NVDA — GPUs / COMPUTE
↓
SMCI + DELL — SERVERS
↓
NBIS + CRWV — AI COMPUTE CAPACITY
↓
LITE — OPTICAL CONNECTIVITY
↓
SNDK + MU — MEMORY / STORAGE
The week's earnings were effectively validating different portions of the same capital-spending ecosystem.
That's PIN ACTION™.
You don't just watch NVIDIA.
You ask:
Where does NVIDIA's success force the next dollar to be spent?
For Lumentum, the answer is increasingly:
Moving all that AI data
ART IN THE CHART™
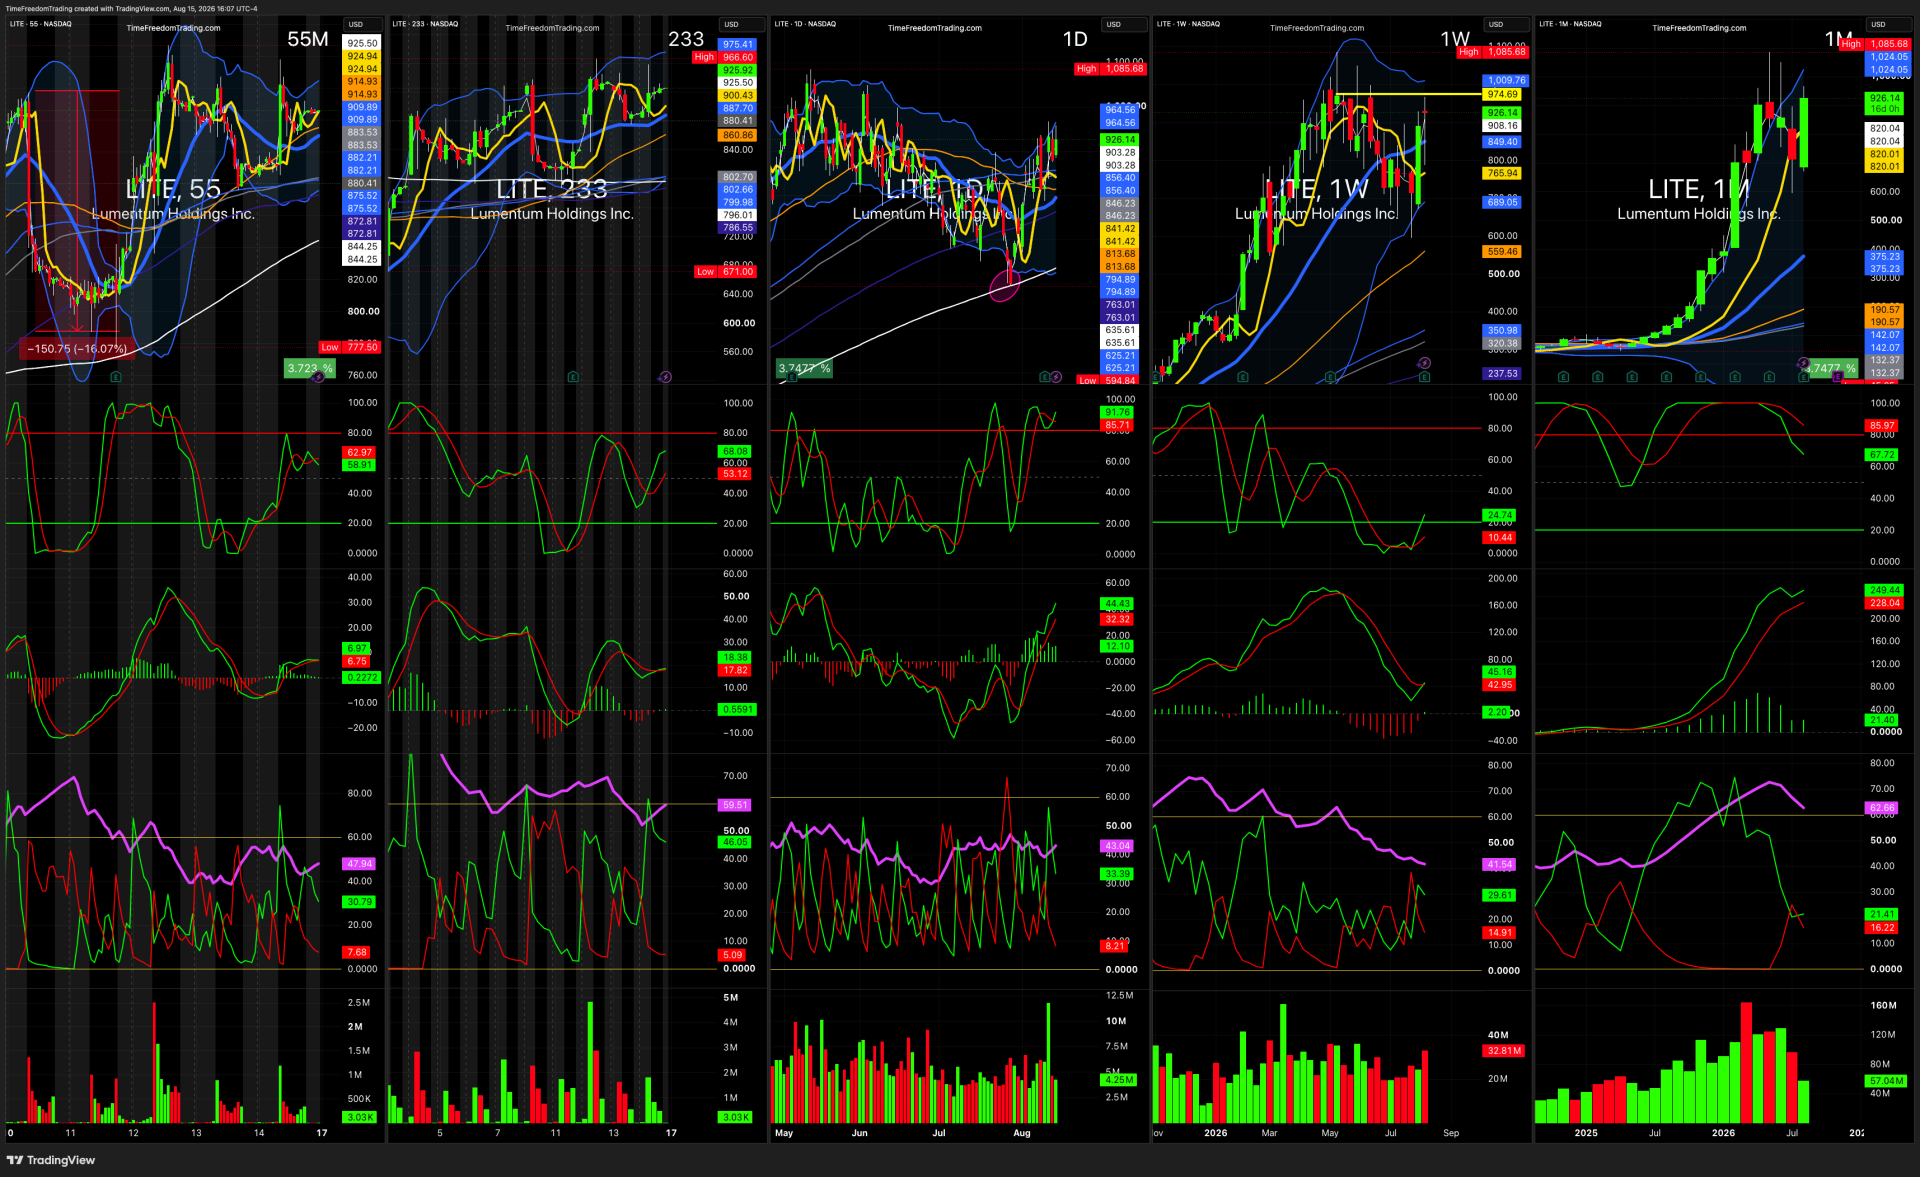
The most interesting part of your multi-timeframe chart is the contrast between short-term volatility and long-term structure.
The 5-minute chart shows the violence.
The 55-minute and 233-minute charts show the recovery.
The daily chart shows LITE bouncing aggressively after testing major longer-term support.
And the weekly/monthly charts show why institutional traders could view the decline differently from somebody staring only at the first red earnings candle.
That's the lesson:
TIMEFRAME CHANGES PERSPECTIVE.
A 16% collapse on a 5-minute chart can look catastrophic.
On a larger timeframe, that same move may be a violent test of support inside a much larger secular trend.
THE BIG LESSON
— DON'T MARRY YOUR FIRST THESIS
LITE is a perfect example of why traders get destroyed trying to prove themselves right.
Imagine shorting the initial earnings breakdown.
Good trade.
Then price stops falling.
Volume changes.
Support holds.
VWAP gets reclaimed.
Higher lows appear.
But you're still saying:
“Yeah, but the earnings reaction was bearish.”
Congratulations.
You're now arguing with the market.
The professional response is different:
Trade #1 ended.
Now evaluate Trade #2.
Your job isn't to remain loyal to your prediction.
Your job is to remain loyal to price.
TFT READ — FOLLOW THE BOTTLENECK
The Lumentum trade gave us three lessons in one.
First: Earnings create volatility. Price action determines the trade.
Second: A failed breakdown can become an even more powerful
signal than the original breakdown.
Third: Always understand the larger ecosystem behind the ticker.
AI doesn't stop at NVIDIA's GPU.
Those GPUs have to communicate.
Servers have to connect.
Clusters have to scale.
Data has to move.
And when billions of dollars of silicon are sitting around waiting for information because the network can't keep up...
somebody gets paid to remove the bottleneck.
This week, Lumentum showed us both sides of the trade:
−16.1% FLUSH → +15.4% REVERSAL
Wall Street threw LITE out of the club.
Then apparently checked the guest list and let it right back in.
Trade the reaction.
Respect the reversal.
Follow the bottleneck.
Follow the invoice.™

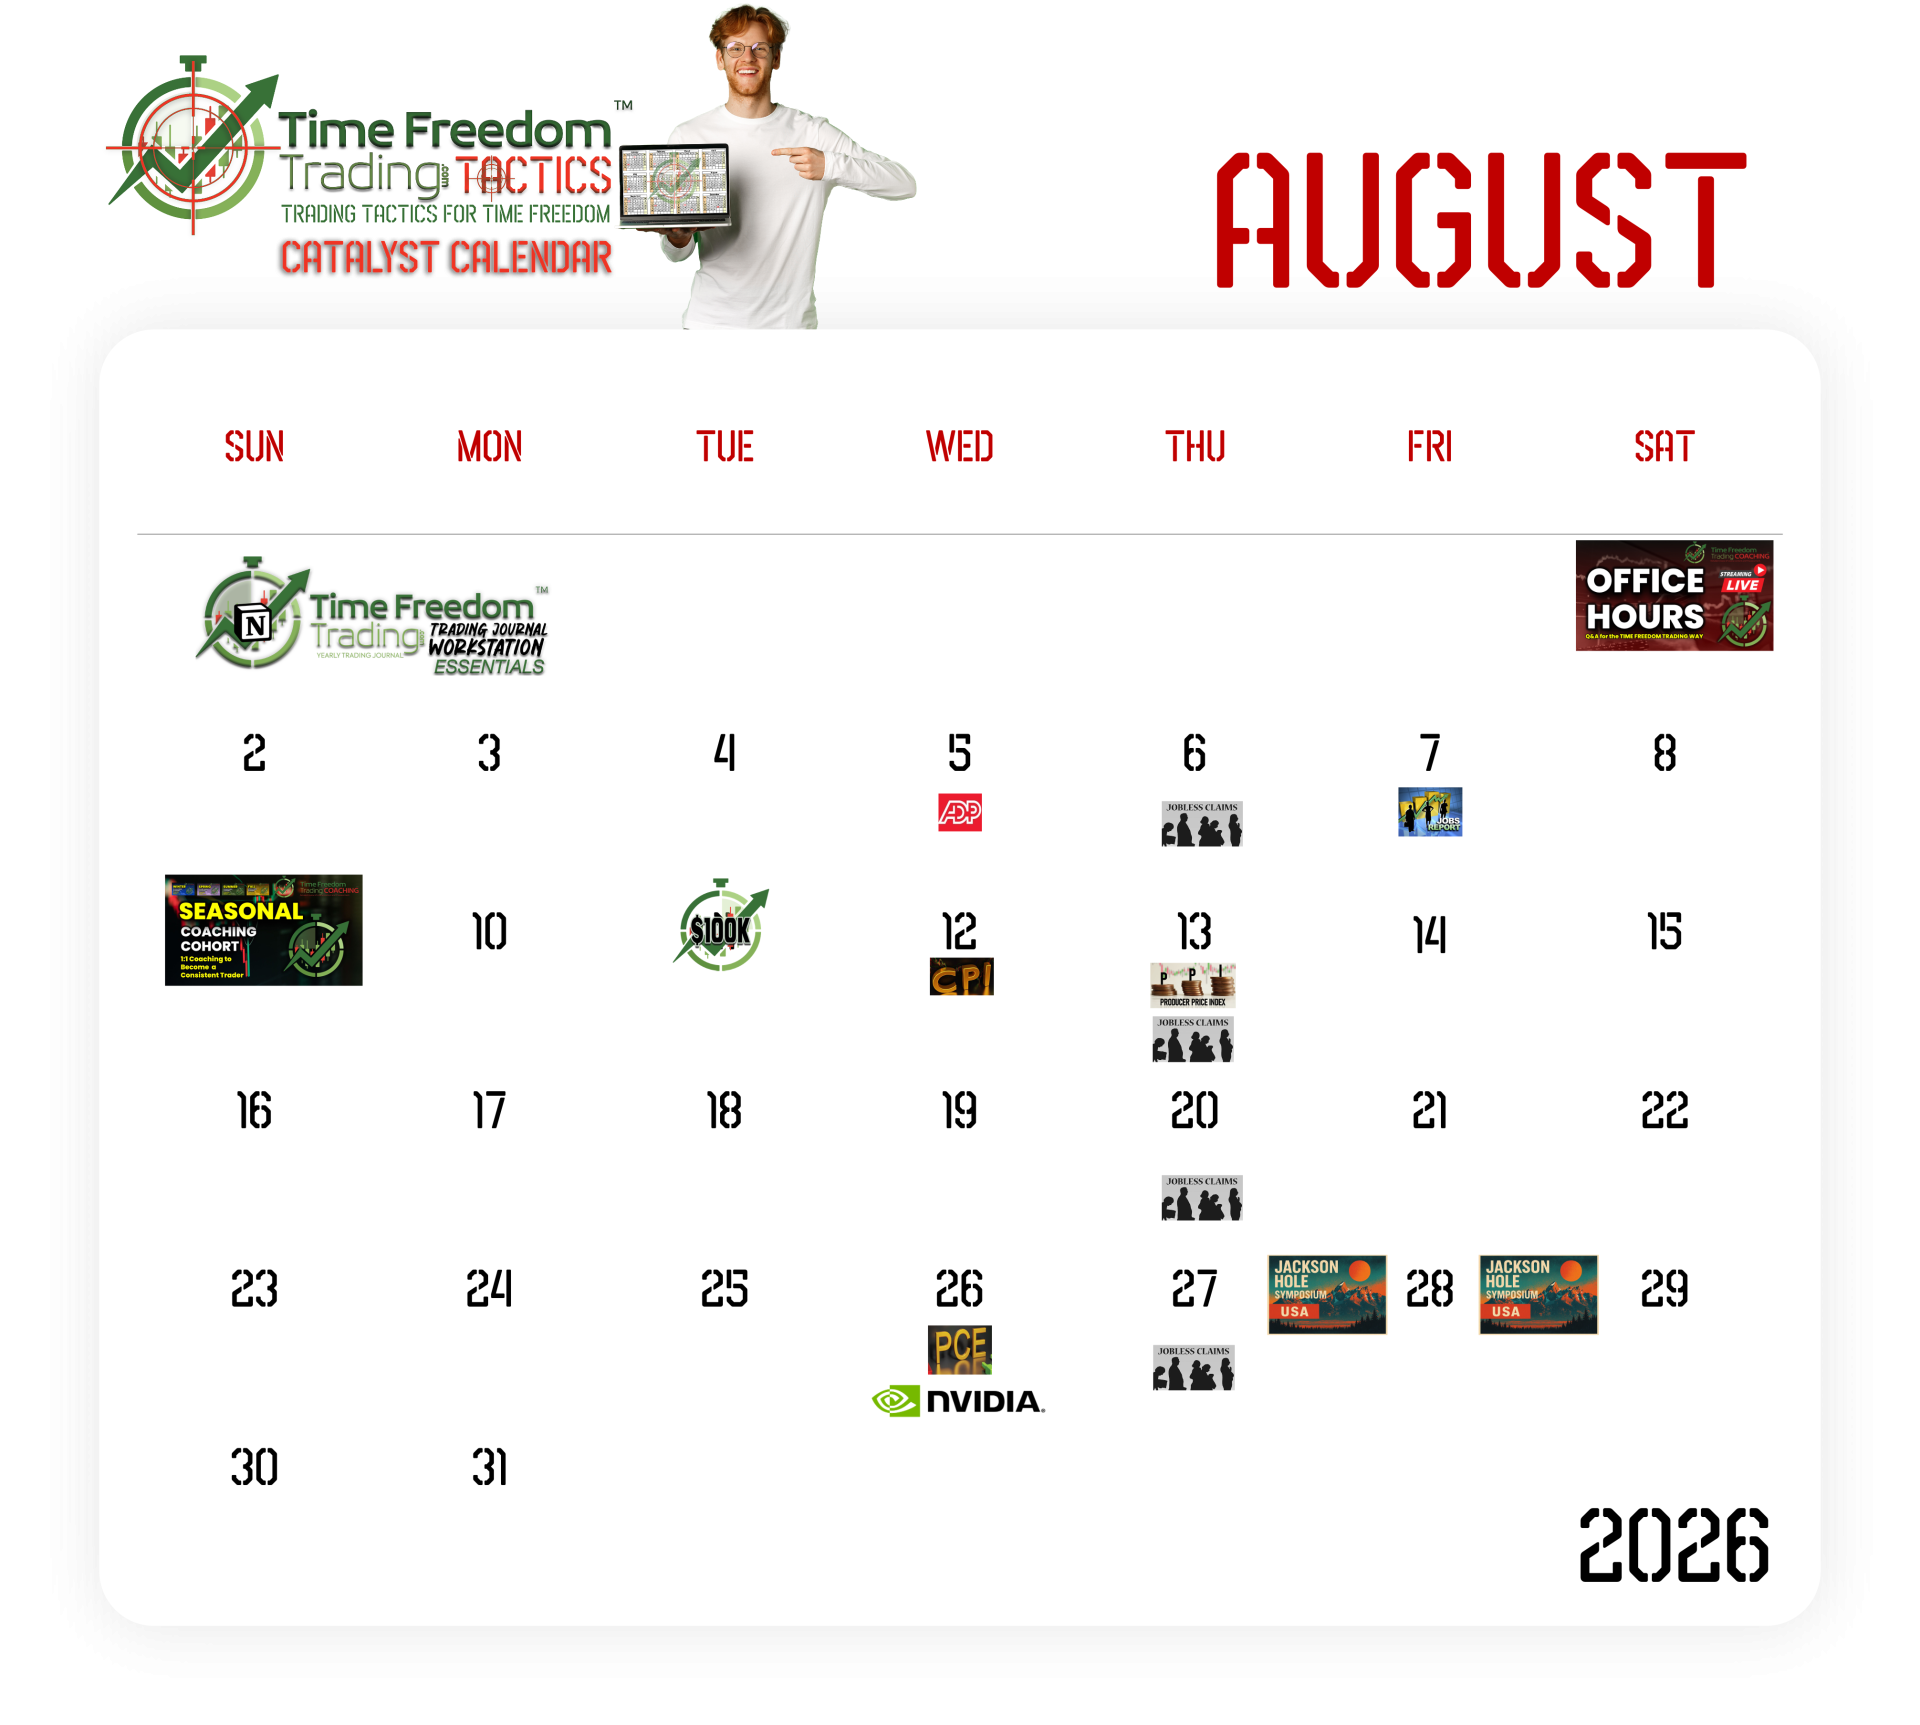
WEEK 34 : THE WEEK AHEAD
Monday doesn't start Monday morning.
It starts this weekend.
Build three lists:
LEADERS: SNDK, NBIS, LITE and other AI infrastructure names showing relative strength.
CATALYST WATCH: Retail earnings, housing data, Fed minutes and oil.
FAILED LEADERS: Names unable to respond positively to good news.
Your objective isn't predicting the market.
Your objective is being prepared for whichever market shows up.
KEY CATALYSTS NEXT WEEK:
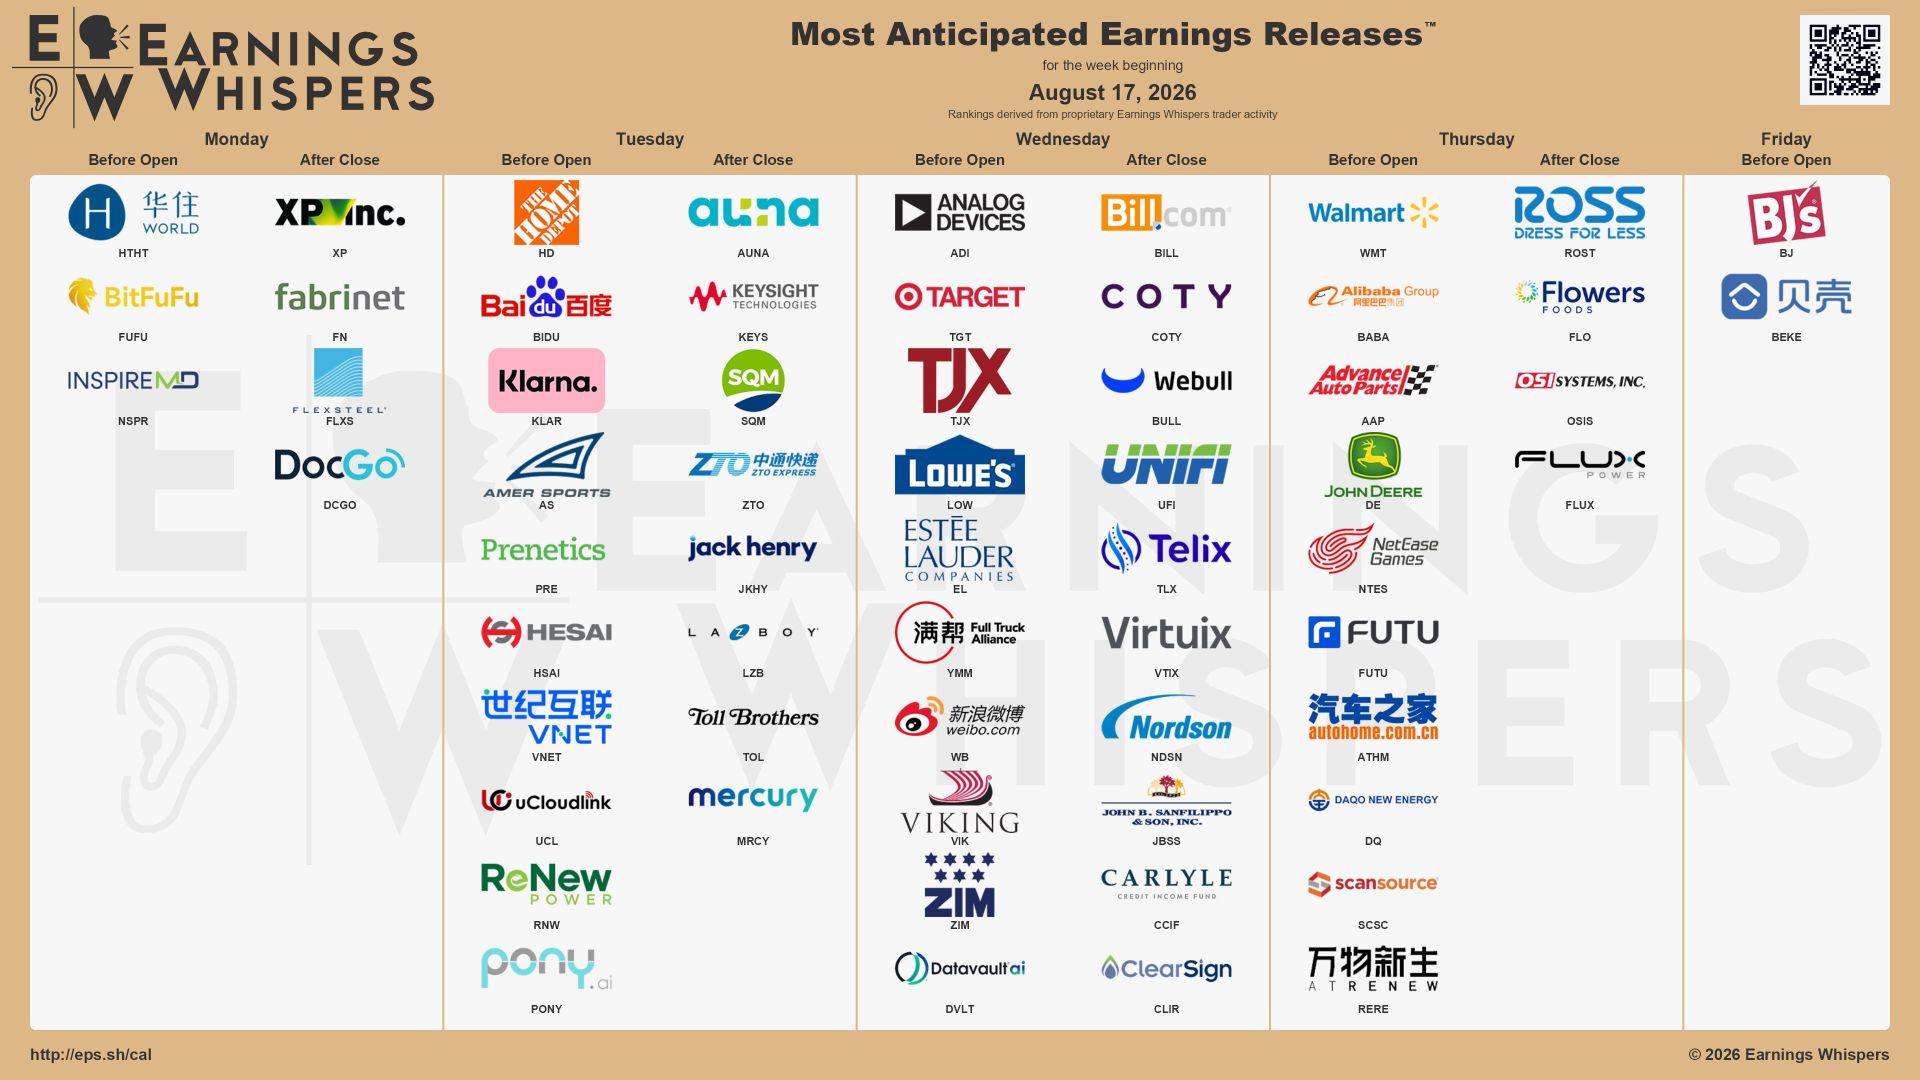
The week of August 17–21 puts housing and the Federal Reserve back in focus, while major retailers report earnings. Barron's highlights Walmart, Home Depot and Target among the major reporters.
Watch:
Housing Starts / Building Permits — housing sensitivity to high rates.
FOMC Minutes — clues about the Fed's inflation-versus-growth debate.
Retail Earnings — the real-time consumer stress test.
Oil — Brent near $90 changes the inflation conversation.
Treasury Yields — the 10-year finished Friday around 4.70%.
Translation:
Don't merely watch whether the data is good or bad.
Watch how price reacts to it.
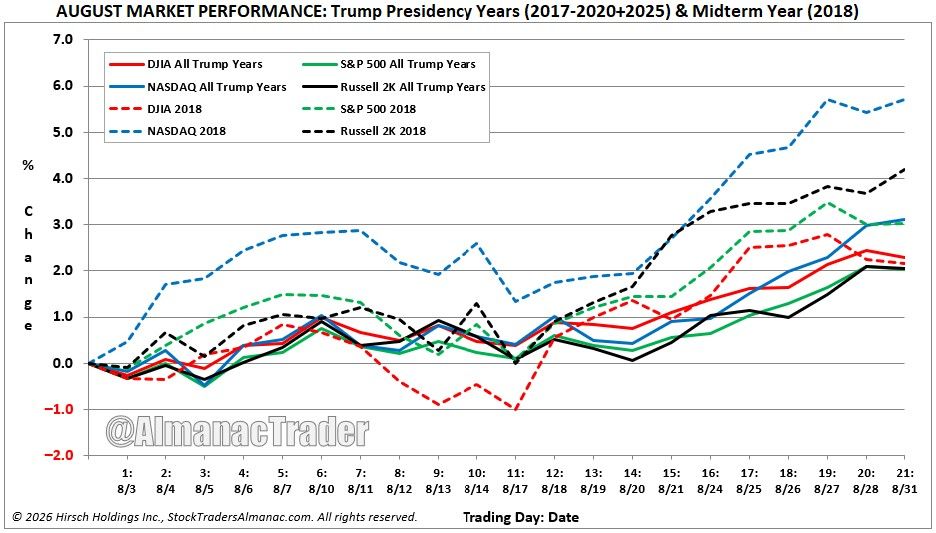
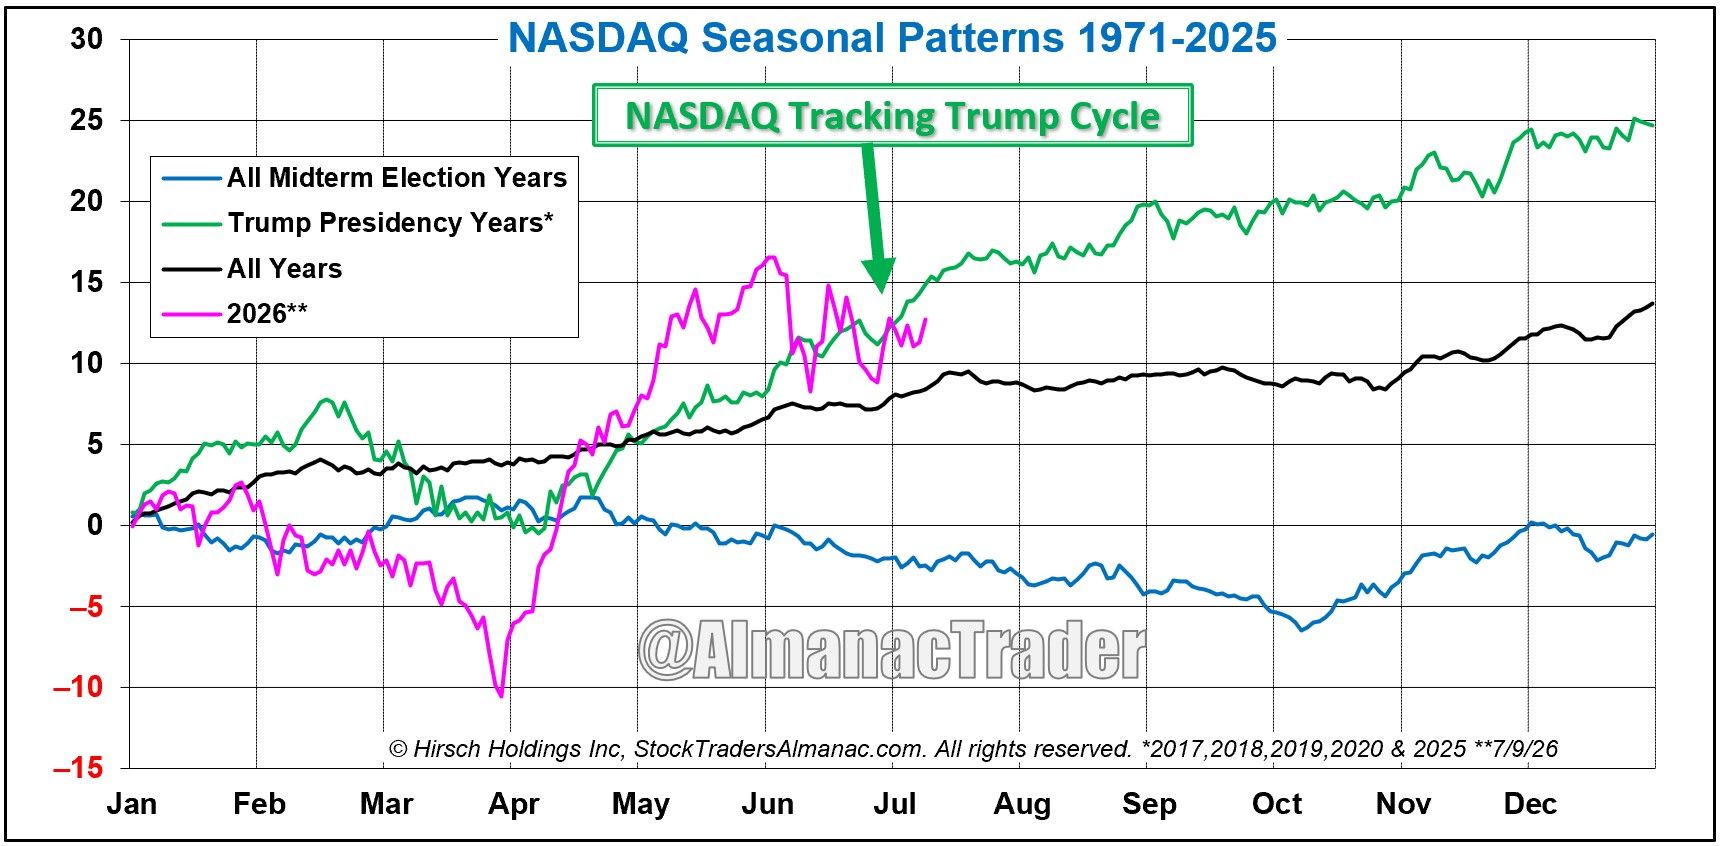
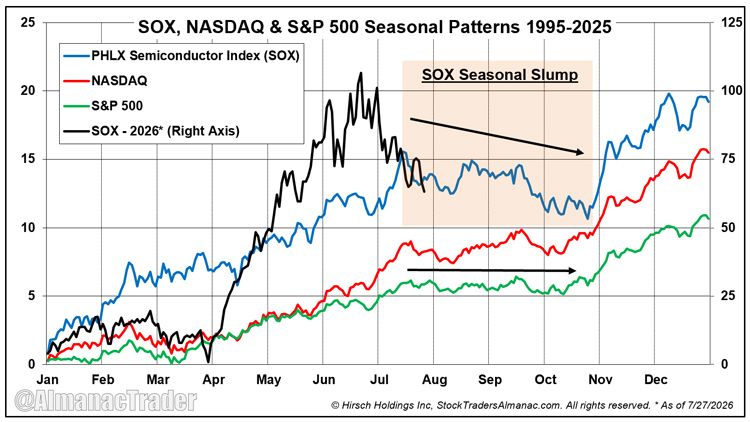
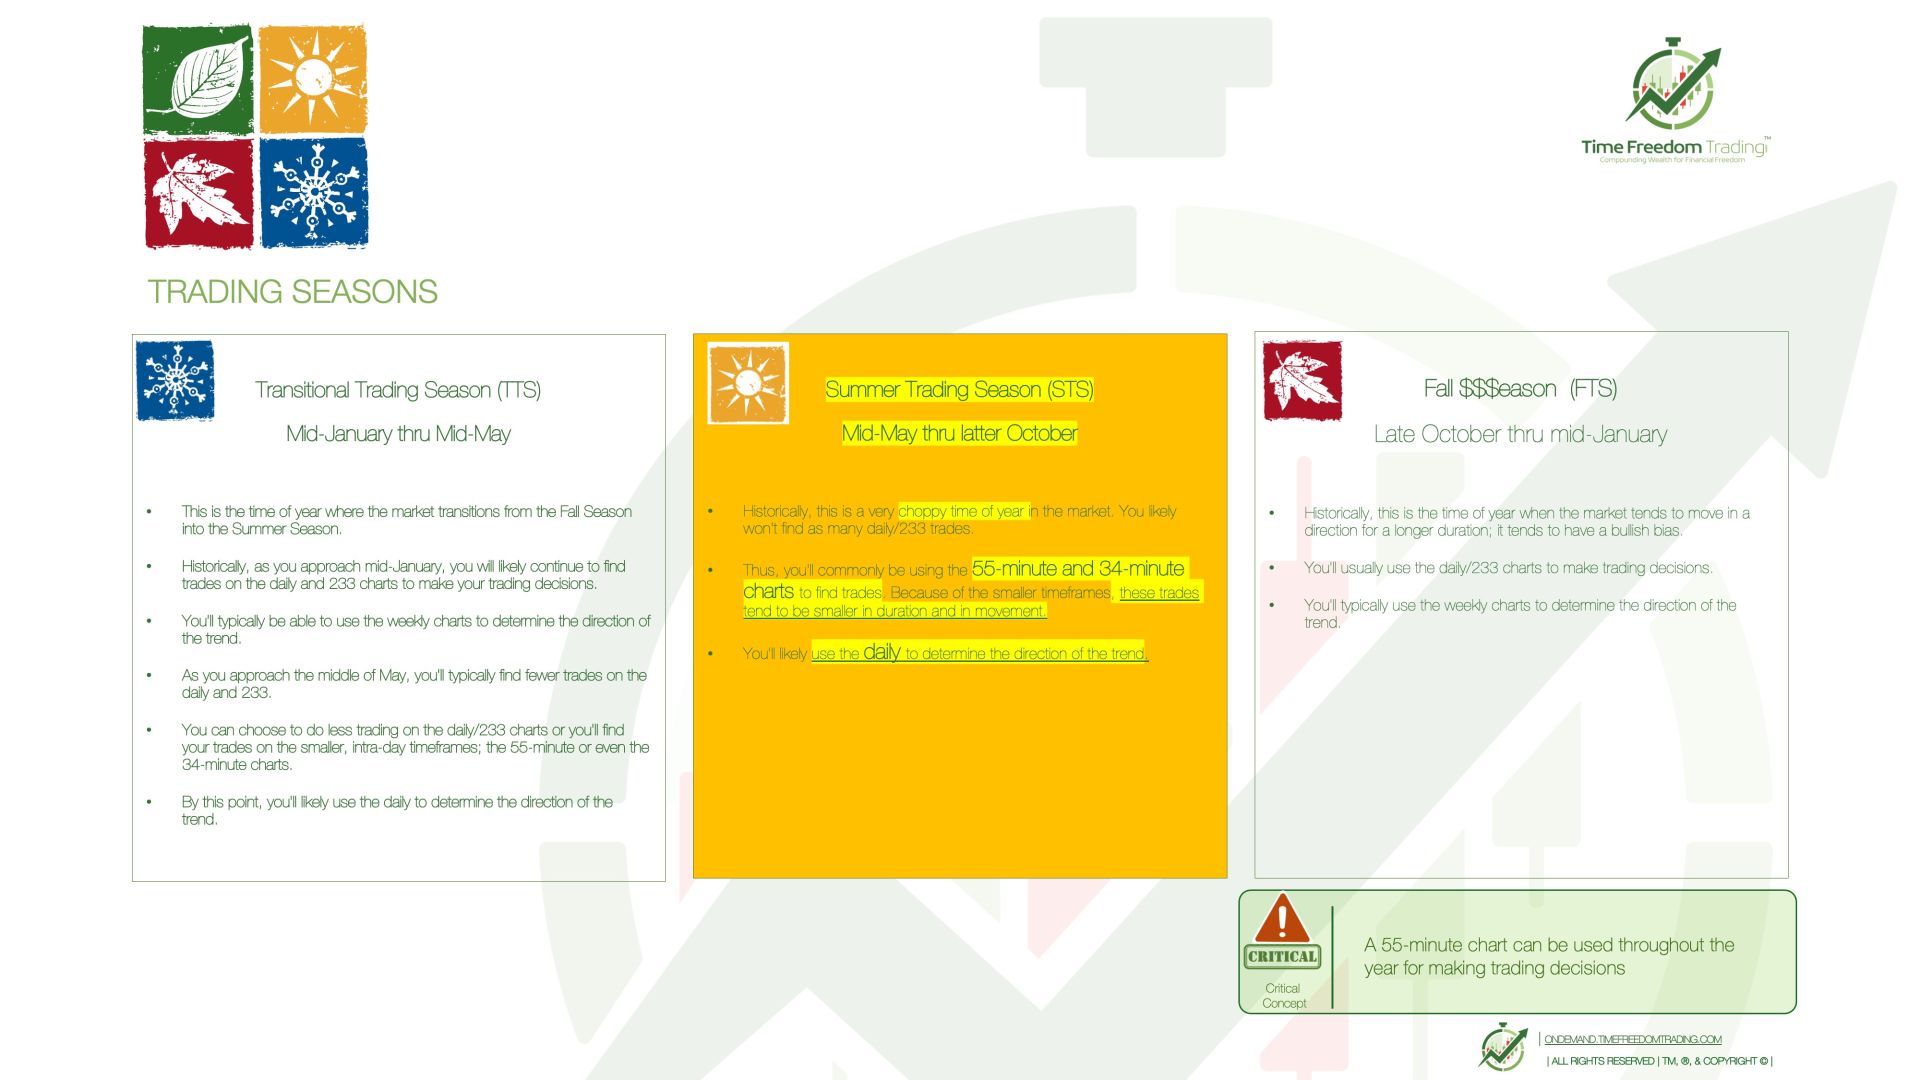

Week 34 Outlook
Aug 17–21st, 2026
THE MARKET HAS MONEY.
NOW IT NEEDS A REASON.
STRENGTHS
— THE BULL STILL HAS A CREDIT CARD
The market enters the week with one undeniable advantage: price remains strong. Major indexes are sitting around record territory, but the more interesting development is what is happening underneath them. Small caps are participating, which suggests capital isn't simply hiding in the same handful of mega-cap technology names. Meanwhile, the AI capital-expenditure machine continues writing checks across chips, servers, compute, memory, networking, optics, cooling and power. Add a low VIX, and financial conditions remain friendly enough for risk-taking. The bull isn't surviving on motivational quotes; corporations are spending real money and institutions are following the invoices.
TFT READ: As long as breadth expands and leadership rotates rather than disappears, respect the trend. Bears have predicted eleven of the last three corrections. Eventually they'll be right. Being early doesn't pay interest.
WEAKNESSES
— PERFECTION HAS BECOME THE COVER CHARGE
The problem with record prices is that eventually the market starts demanding record execution. Valuations are elevated, which means companies no longer receive participation trophies for beating earnings estimates. AMAT demonstrated the problem perfectly: strong results and strong guidance can still produce selling when expectations have climbed even faster than fundamentals. At the same time, softer consumer data raises questions about how much longer households can keep swiping the national credit card, while elevated long-term Treasury yields continue competing with stocks for capital and pressuring valuation multiples.
TFT READ: This isn't necessarily bearish; it's unforgiving. When expectations are priced for perfection, "good" becomes disappointing. Wall Street is basically your father-in-law now: impressive quarter, nice margins, record revenue... but what are you doing next quarter?
OPPORTUNITIES
— FOLLOW THE MONEY BEFORE CNBC NAMES THE TRADE
The best opportunity may be the continued broadening of leadership. Small-cap strength creates new hunting grounds beyond the usual Magnificent Seven obsession. Retail earnings give us a real-time consumer stress test. AI infrastructure earnings continue revealing where the next dollar of capital expenditure is traveling—from NVDA compute into NBIS/CRWV capacity, LITE optical connectivity, SNDK/MU memory and the rest of the infrastructure stack. Meanwhile, violent earnings reactions are creating another opportunity: quality companies can become temporarily dislocated, producing post-earnings reversals, gap continuations and oversold bounces.
TFT READ: Stop asking, "What's the next NVIDIA?" Ask, "Where does NVIDIA's success force somebody to spend money next?" That's pin action. Chips need servers. Servers need data centers. Data centers need networking, memory, cooling and electricity. Follow the invoice.™ By the time everybody calls it a new asset class, somebody has already collected three quarters of rent.
THREATS
— THE MATCHES ARE SITTING NEXT TO THE GASOLINE
The market may be calm, but several potential volatility catalysts are sitting quietly in the corner sharpening knives. Oil approaching $90 threatens to reintroduce inflation pressure just as investors are getting comfortable with the disinflation narrative. Geopolitical escalation could push energy higher and trigger an immediate risk-off reaction. Persistent inflation could keep the Fed restrictive, while another breakout in long-term Treasury yields would challenge expensive growth-stock valuations. And perhaps the most dangerous threat is complacency itself. A low VIX near record highs can convince traders that risk has been abolished by executive order. It hasn't.
TFT READ: Markets rarely send invitations to corrections. The moment everyone decides nothing can go wrong is usually when Wall Street checks whether your stops are decorative. Don't predict the punch. Know where you're getting out before somebody throws it.
THE 3D™ READ
The SWOT doesn't say BUY or SELL.
It tells us where to look.
Strength: Trend + breadth.
Weakness: Valuation + expectations.
Opportunity: Rotation + AI pin action.
Threat: Oil + yields + complacency.
That's the setup for next week:
FOLLOW ROTATION.
TRADE THE CATALYST.
RESPECT THE RISK.
Because the market can remain bullish while individual stocks get taken behind the woodshed.
And the question isn't whether the next week will be bullish or bearish.
It's:
When the market shows its hand, will you already have yours mapped—or will you start making decisions after the money starts moving?
“Everyone gets what
they want out of the market.”
— Ed Seykota
“Earnings are an opinion;
cash flow is a fact.”
| Alfred Rappaport
The Stock market does NOT repeat...
but it does rhyme!

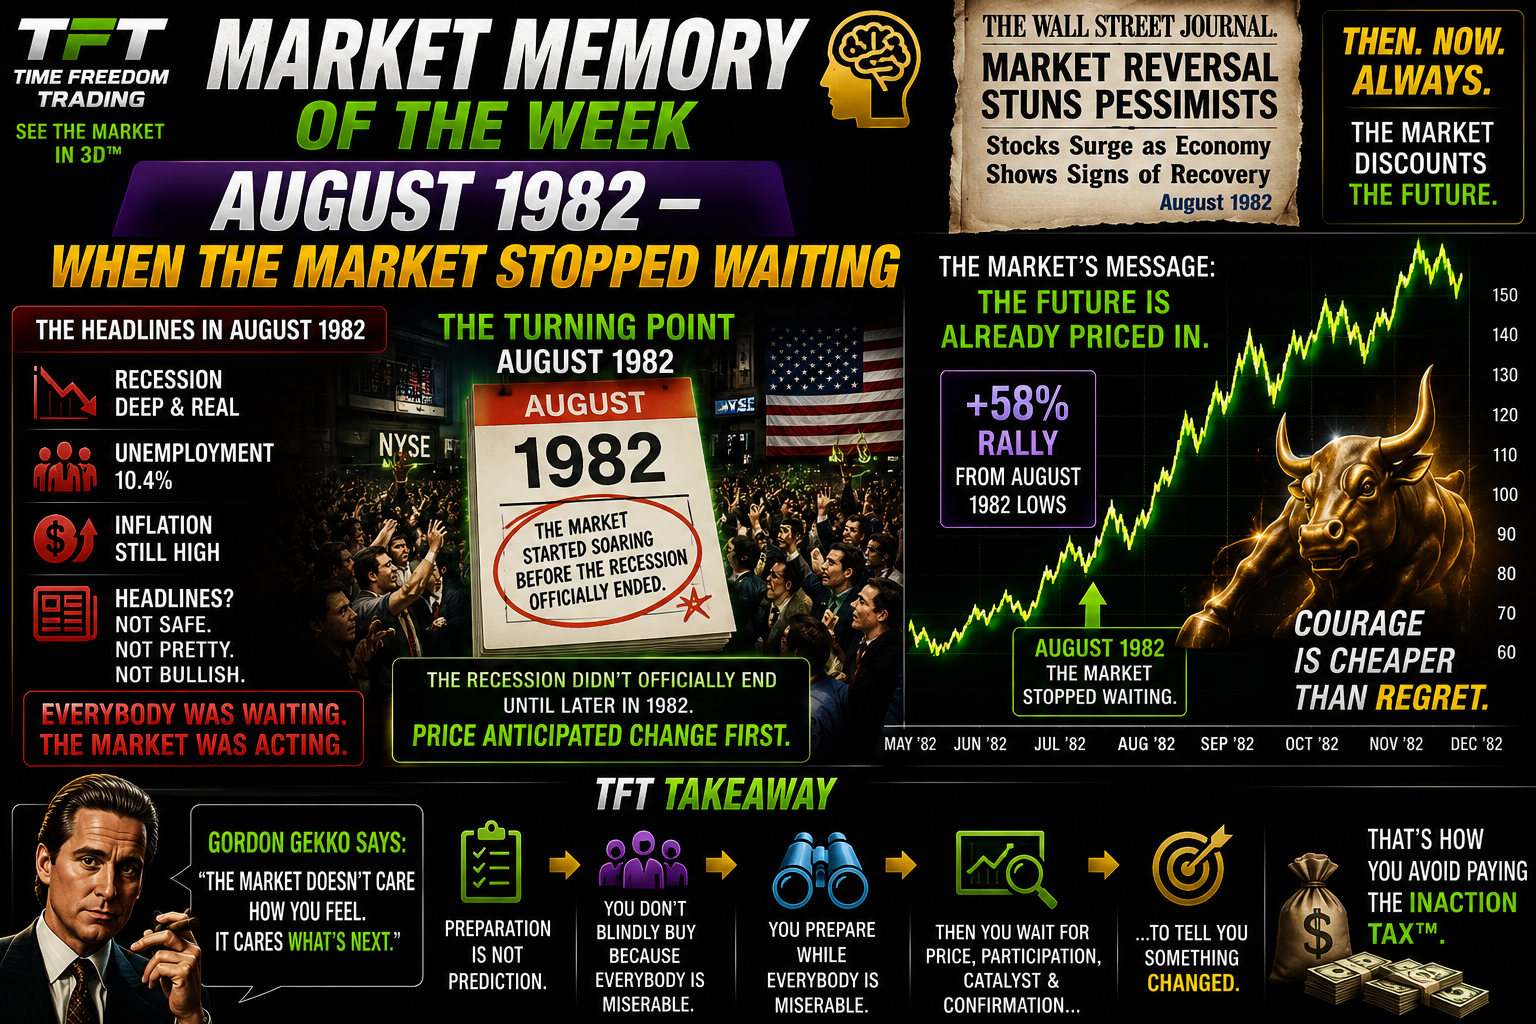
AUGUST, 1982 - END OF SUMMER TRADING
AUGUST 1982 — WHEN THE MARKET STOPPED WAITING
August 1982 remains one of Wall Street's most valuable reminders.
America was still suffering from recession, high unemployment and the aftermath of brutal inflation.
The headlines didn't look safe.
Stocks turned anyway.
The great lesson isn't that August is magically bullish.
It's that markets discount the future before the present feels comfortable.
The recession didn't officially end until later in 1982.
Price began anticipating change first.
That's why waiting for complete certainty can become expensive.
TFT TAKEAWAY
Preparation is not prediction.
You don't blindly buy because everybody is miserable.
You prepare while everybody is miserable.
Then you wait for price, participation, catalyst and confirmation to tell you something changed.
That's how you avoid paying the Inaction Tax™.
“The market pays you for being right… but only after it tests your patience.”
— Ed Seykota

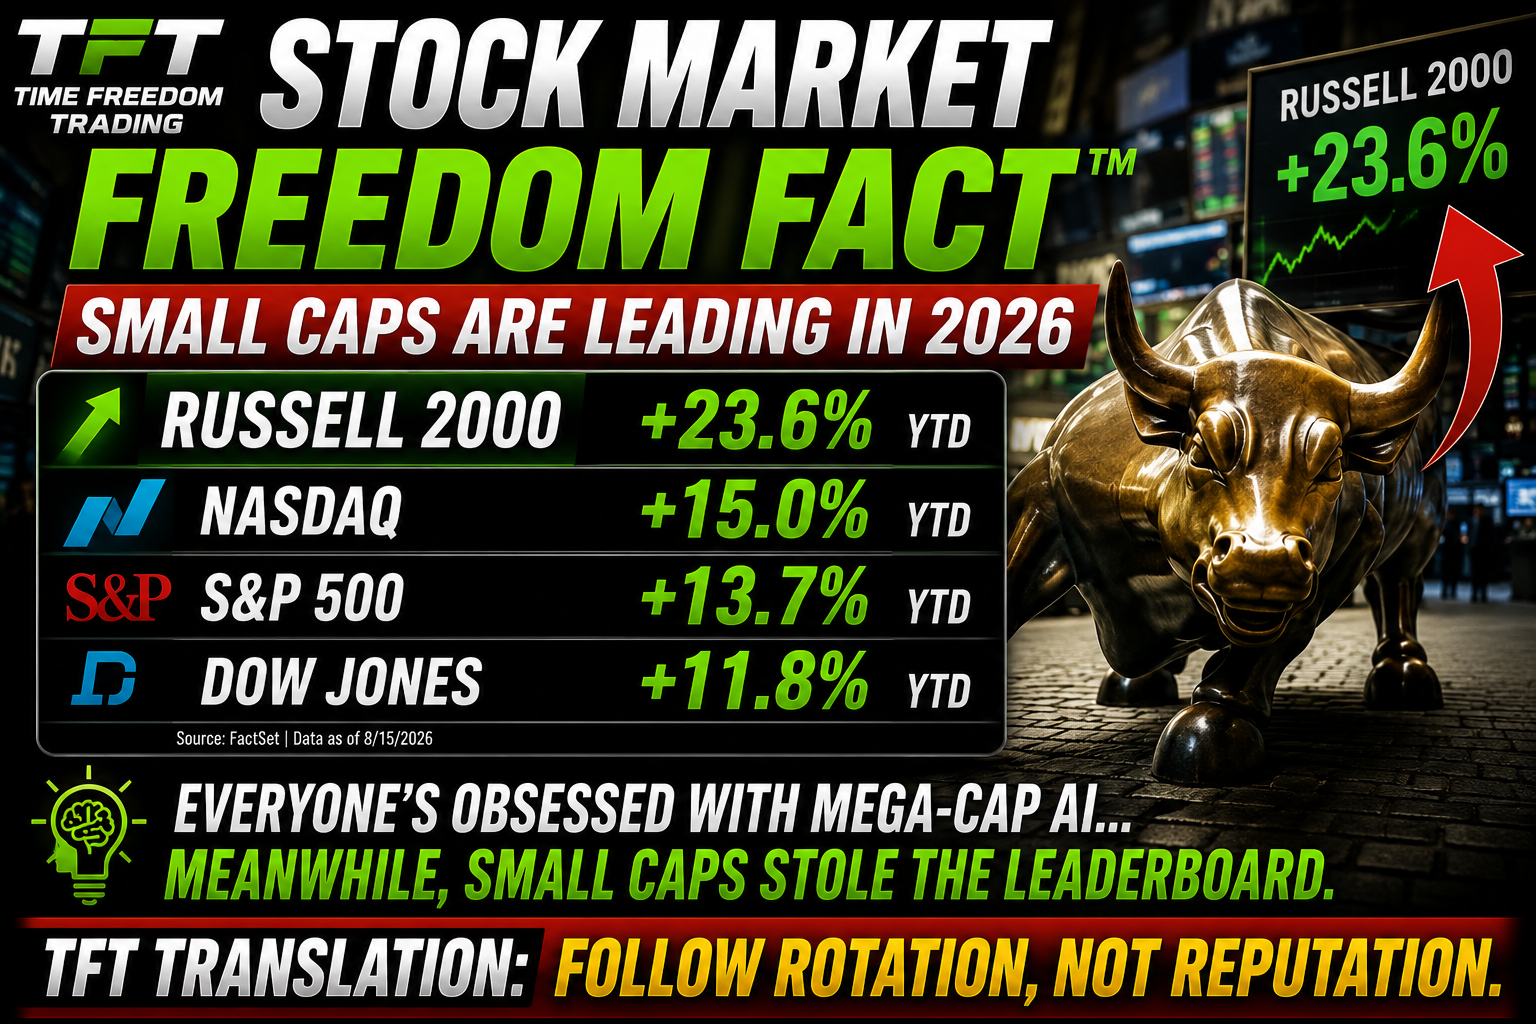
Small caps remain
the sleeper story of 2026.
The Russell 2000 is now approximately +23.6% YTD, ahead of:
Nasdaq: +15.0%
S&P 500: +13.7%
Dow: +11.8%
Everyone keeps staring at mega-cap AI.
Meanwhile, small caps quietly stole the leaderboard and apparently changed the locks.
TFT TRANSLATION
FOLLOW ROTATION, NOT REPUTATION.
“The big money is not in
the buying or selling,
but in the waiting.”
| Jesse Livermore

“The plans of the diligent lead surely to abundance, but everyone who is hasty comes only to poverty.”
— Proverbs 21:5
Domain: DISCIPLINE
Seven Figure Way Principle: DILIGENCE
“The plans of the diligent lead surely to abundance, but everyone who is hasty comes only to poverty.” — Proverbs 21:5
Markets reward preparation because opportunity rarely sends you an Outlook invite titled:
“Generational Entry — 9:47 AM. Business Casual.”
You build the watchlist first. Map the catalyst first. Define invalidation first. Understand the environment first. Then when volatility arrives, you're executing a decision rather than inventing one while your adrenaline is driving.
Your money is a seed.
Every dollar can be consumed, parked or cultivated. Abundance isn't reckless risk-taking. It's intelligent stewardship applied repeatedly. Diligence means deciding what job your capital has before emotion volunteers it for something stupid.
ACTIONABLE SUMMARY
- Build Monday's watchlist this weekend.
- Define the catalyst before the trade.
- Define invalidation before entry.
- Follow relative strength.
- Let confirmation unlock capital.
- Cultivate dollars deliberately.
Preparation creates optionality. Discipline protects it.
THE FINAL WORD...
HOW MUCH DID
INACTION COST YOU
THIS WEEK?
SNDK moved. RDDT moved. NBIS moved. LITE moved. AMAT gave traders volatility in both directions.
The market didn't run out of opportunity.
The question is:
Did you run out of courage?
Not reckless courage.
Not “YOLO the mortgage into calls because a guy with a rocket emoji said AI.” courage.
Prepared courage.
The courage to build the watchlist.
The courage to map the catalyst.
The courage to wait for confirmation.
The courage to define your risk.
And then—the part most people never master—the courage to ACT when your edge appears.
Because hesitation has a price.
I call it the Inaction Tax™.
It doesn't appear on your brokerage statement.
There's no line item saying:
OPPORTUNITY MISSED: −$4,782
But you pay it anyway.
You pay it every time preparation becomes procrastination.
Every time fear disguises itself as “I'll wait for more confirmation.”
Every time the market gives you the setup you spent months learning—and you suddenly become a spectator.
COURAGE IS CHEAPER THAN REGRET.
And we're entering one of the most important stretches of the year.
Fall.
Earnings.
Rotation.
Institutional repositioning.
Year-end capital flows.
Potential volatility.
Potential opportunity.
So here's your gut check:
What are you planting now?
Because your money is a seed.
You can consume it.
You can let it sit.
Or you can learn how to cultivate it.
But don't expect a harvest from seeds you were too afraid to plant.
That doesn't mean throwing money at every green candle. That's not courage. That's gambling wearing a Bloomberg terminal costume.
It means doing the work before the opportunity arrives so that when the market presents your edge, you're ready.
Build the watchlist.
Study the catalysts.
Know the levels.
Define the invalidation.
Protect the downside.
Then execute.
Because the goal isn't another winning trade.
The goal is building the Financial Flywheel™ that can compound skills, capital, confidence and eventually time freedom.
MAKE 2026 THE YEAR OF YOUR PIVOT TO PROVIDENCE.
Not the year you almost started.
Not the year you watched everybody else participate.
Not the year you promised yourself:
“Next time.”
There are only a few months left in 2026.
So ask yourself one uncomfortable question:
If you keep making the same decisions, hesitating at the same moments and leaving your seeds sitting in the bag—what exactly do you expect to harvest when December arrives?
Plant intelligently.
Cultivate consistently.
Let discipline compound.
And when your opportunity comes—
HAVE THE COURAGE TO TAKE IT.
COURAGE IS CHEAPER THAN REGRET.
Plant your seeds now so your harvest can be bountiful in the fall moves ahead.
CHANGE THE OPERATOR.
BUILD THE FLYWHEEL.
GET F.R.E.E.
Make 2026 the year you stopped waiting—and started your pivot to Providence.
Want to
"SEE"
the Market
Correctly?
SEE the Market
Like a Time Freedom Trader!
Most people stare at charts the way rookies stare at MRI scans —
lots of squiggles… zero understanding… and a whole lot of “uhhh, is this bad?”
Time Freedom Traders don’t look at the market.
We see it — in 3D, in real time, with clarity sharp enough to slice through Wall Street noise.
We see:
-
Rotation before it rotates
-
Catalysts before they explode
-
Turns before they trend
-
Opportunities while everyone else is still doom scrolling
This is the difference between traders and operators.
One guesses.
One reads the market like a playbook.
And it starts with using the right tools.
If you want to see what we see, the way we see it —
you need charts that don’t lie, lag, or limit your edge.
That means TradingView.
- Clean charts.
- Real-time data.
- Precision tools.
- Time Freedom Trading Custom Indicators - to "See" the MOVES correctly!
Everything you need to trade the turn, not chase the move.
👉 Sign up for TradingView today and start seeing the market like a Time Freedom Trader.
Your clarity starts the moment your charts go HD.
Because remember —
You’re just one trade away.

LIVE LIKE
A SUPER HERO!
A SUPER HERO!
If you’re ready... it’s time to level up.
Join our Coaching Cohort, where we teach traders how to:
- Think like a Trader and Investor
- Build your own "consistency code"
- Grow into Profits with Providence.
No more hesitation. Just a proven path to financial freedom.
Click below to join the Time Freedom Trading Coaching Cohort and start trading the $1KWay today!
Join the TIME FREEDOM TRADING Coaching Cohort Today!
Discover how Time Freedom Trading can help you start building your Financial Flywheel and your trading plan to HIT SIX in 2026!
Freedom awaits—are you ready to claim it?
| Clinton - The "Bald Bull" James

P.S.S. PLEASE PAY IT FORWARD!
GIVE TIME FREEDOM - SHARE THIS LINK
Every one deserves Time Freedom!
If you know someone who would like to learn to earn time freedom, please forward this email / link and share the freedom!
Your network will appreciate it (and remember you) for sharing thoughtful content.
If you enjoyed this micro-lesson please share this link on social.


Get the "GET FREE" Bundle

10 TIME FREEDOM TRADING TACTICS YOU WILL LEARN!
- Learn your real freedom number to earn time freedom trading in the stock market. (it's smaller than you think!)
- Learn how to see market manipulation by large institutional investors and profit from their movements.
- Learn how to make money in an up, down, or sideways market. More importantly, you will learn a quantitative approach to know when NOT to trade in the stock market to protect your capital.
- Develop the proper paper trading skills and processes to prove your trading ability in the stock market before risking a single dollar!
- Learn the proper trading chart configurations to see the markets in 3D and clearly see market moves before your trade!
- Understand the difference between retail trading (prey) and professional trading (predator)strategies and how to profit from both mindsets in the stock market.
- Learn simple trading strategies that only require 5th-grade math. No complex calculations or buzzwords to confuse you.
- Create simple automated trading tactics with your
broker that allow you to place a simple trade on autopilot and minimize
your risk while maximizing your gain for a trade.
- Join a live daily trader community chat that will discuss market moves in real-time to accelerate your learning and close your experience gap faster.
- Experience the seasonality of the stock market with a veteran trader to learn how to profit in all months and seasons of the year to earn time freedom!
✓ Quantified Strategies: Learn to identify repeatable trading patterns to profit in the markets with systematic, data-driven methods.
✓ Practical Examples: Real-world cases, demonstrated strategies in action.
✓ Consistent Results: Strategies that have proven successful for decades are now accessible to you.




When your ready;
There are five (5) ways I can help.

1.0 Subscribe to
The GET F.R.E.E. Report
Join the Time Freedom Trading Community. SIGN UP for The GET F.R.E.E. REPORT newsletter and learn how to earn TIME FREEDOM from your INBOX! Get trading strategies and get elements of the Time Freedom Trading Operating System in your inbox! Time Freedom Awaits!
The GET F.R.E.E. REPPORT
2.0 Subscribe to
TIME FREEDOM TRADING TACTICS
Get an "investing lesson" on the 1st of every month in your inbox with simple tactics you can implement immediately to start earning time freedom.
TIME FREEDOM TRADING TACTICS
3.0 The Time Freedom Trading
ON DEMAND COURSES
The #1 On-demand Trading Curriculum for learning Trading MECHANICS, Trading DYNAMICS, Trading STRATEGY, and Trading MINDSET.
Join the TIME FREEDOM TRADER COMMUNITY in our flagship courses. Time Freedom Trading teaches you exactly how to lose less and make more by learning a simple system to compound profits in the stock market.
Come inside and get over 25 years of trading expertise, proven methods, and actionable strategies to help Main Street earn Wall Street profits by trading and investing in the stock market.
Ondemand.TimeFreedomTrading.com
4.0 The Time Freedom Trading COACHING COHORT
Join Time Freedom Traders learning "live and in real-time" the seasonality of the stock market. This comprehensive Trader Coaching Cohort will teach you 1:1, in live Cohort sessions, and open office hours, specifically how to trade the seasons of the stock market and learn from live Market Moments for profitable trading strategies.
The WINTER, SPRING, SUMMER, and FALL seasons all have different dynamics to profit from in the stock market. Build the proper knowledge, process, and skills to leverage the exact system I used to gain TIME FREEDOM all year through by effectively trading the stock market with seasonal catalysts. Grow your account with real money with the $1K to $100K Way and earn time freedom your way.
Time Freedom Trading Coaching Cohort
5.0 The FREEDOM FRIENDS & FAMILY AFFILIATE PROGRAM

Join the Time Freedom Trading Affiliate Program at no cost to you, and GET PAID to share the gift of TIME FREEDOM with friends and family. Refer others to Time Freedom Trading and share your personal affiliate link ID to earn a commission on every offering we sell.
Help Time Freedom Trading scale to reach more TIME FREEDOM TRADERS and fund your $1K WAY to earn time freedom. Become a partner to scale the Time Freedom Trader Community.
Giving back and paying it forward with Time Freedom Trading is a WIN-WIN for all!
BECOME A FREEDOM FRIENDS & FAMILY AFFILIATE
"Wall Street never changes. The pockets change, the suckers change, the stocks change, but Wall Street never changes, because human nature never changes."
- Jesse Livermore

SUBSCRIBE TO THE NEWSLETTER
Join TIME FREEDOM TRADERS who are readers of
The W.ith T.ime F.reedom Report for exclusive tips, strategies, and resources to learn how to trade and invest in the stock market.

Register for the
FREEDOM FRIENDS & FAMILY
AFFILIATE PROGRAM!

Get More WTF REPORT!
26 DECISIONS THAT WILL DECIDE YOUR 2026

#45 STOP PAYING IGNORANCE TAX

NEW YEAR: UNCERTAIN TIMES. CERTAIN EDGE.

#44 YOUR TRAINING YOUR AI REPLACEMENT.
#4 FIVE (5) REASONS EVERYONE SHOULD LEARN TO TRADE THE STOCK MARKET

# 38 FIVE YEARS FROM NOW, YOU'LL ARRIVE SOMEWHERE!

#40 Feeling FOMO for Missing the NVIDIA AI Bubble?
Share this Article on:
Learn to Earn Time Freedom;
FREE TO LIVE YOUR LIFE YOUR WAY!

Join us today
Join us today
Join us today
THANK YOU
Join us today
Join us today
Join us today
Learn to earn and earn time freedom with your profits in the stock market. Time Freedom Trading is helping MAIN STREET earn WALL STREET profits through real trading and investing strategies.
Forget the dogma of "set it and forget it" tactics with passive investing that keeps your advisor rich with fees and your account balance diminished with under performing portfolio strategies.
Time Freedom trading is helping MAIN STREET earn WALL STREET PROFITS. Can you afford to NOT find out? What is your old way of investing really costing you. Get started with TIME FREEDOM TRADING today!
Sponsor this Newsletter!
Have questions?
Hit reply to this email and we'll help out!

You are receiving this note because you joined us at one of the Time Freedom Trading websites.
Copyright © www.TIMEFREEDOMTRADING.com
All rights reserved.
About www.TIMEFREEDOMTRADING.com
THE TIME FREEDOM TRADING SYSTEM empowers Main Street with Wall Street knowledge and tools to compound wealth and earn time freedom through proven trading and investing strategies. Learning how the stock market works from the inside is critical to compounding wealth consistently in any market environment. Time Freedom Trading empowers you to build your own financial flywheel based upon your skills and goals. Regardless of the technology or market volatility, with TIME FREEDOM TRADING you will have the right mentor and mental coach who will reveal the patterns in human nature that don’t repeat but do rhyme which you can profit from. Whether it’s stocks, options, exchange-traded funds (ETFs), or futures, we empower you with an effective skill set and tools for everyone at every level of experience to earn time freedom.
Life is short.
MAKE IT WORTH WHILE!
Compounding wealth with Time Freedom Trading can make it long and worthwhile.
Earn time freedom to enjoy life, enjoy your family, and enable the life and legacy you deserve.
Become a Time Freedom Trader Today!
Your Time Freedom Awaits!
TIME FREEDOM TRADING DOES NOT PROVIDE RECOMMENDATIONS OR ADVICE.
FOR EDUCATIONAL AND INFORMATION PURPOSES ONLY; NOT ADVICE. TIME FREEDOM TRADING content is offered for educational and informational purposes only and should NOT be construed as a securities-related offer or solicitation or be relied upon as personalized financial advice. We are not financial advisors and cannot give personalized advice. There is a risk of loss in all trading, and you may lose some or all of your original investment. Results presented are not typical. Please review the full risk disclaimer
LEGAL DISCLAIMERS
ADDITIONAL RISKS