

WEEK 42
GET F.R.E.E.™
WEEKEND REPORT
Financially Ready to Enjoy Everything
WEEK 42
FRIDAY, OCTOBER 16, 2026
THE DOW FINISHED GREEN.
THE CANARY DIDN’T.
TIME FREEDOM TRADING™ | 10 MOVES. ONE MARKET. ONE OPERATOR.
WHAT YOU’LL LEARN:
- What the Russell 2000 signaled about market health.
- How all 11 sectors rotated.
- The Space Economy catalysts and their listed exposures.
- Five trades with Trade DNA™.
- Next week’s catalyst calendar.
Why did the Dow finish higher while the Nasdaq and Russell 2000 broke lower in Week 42?
THE F.R.E.E. ANSWER™ — The market fractured: Dow +0.67%, Nasdaq −4.48%, Russell −3.05%. Defensive staples and energy led while technology cracked. Follow rates → credit → liquidity → breadth → price.
MARKET REGIME: Selective defense under rate pressure. The Dow’s relative resilience contrasted with a sharp Nasdaq retreat and small-cap weakness, while staples and energy showed better relative strength. This is a fragmented, risk-sensitive tape—not a confirmed broad-market recovery. The operator’s confirmation chain remains rates → credit → liquidity → breadth → price. These are TFT interpretations of the week’s reported price action, not claims of verified institutional flows.
YOUR WEEKLY MANIFESTO™: Wall Street handed the Dow a participation trophy while technology and small caps got the invoice. One green index doesn’t make a healthy market any more than one good trade makes you a disciplined trader. The Russell was the canary; the price of money was the cage. Don’t trade the headline. Read the divergence. Respect your No Trade Zone™. Catalyst creates the move. Confirmation gives permission.™
OPENING SLAP™ — Congratulations. The Dow managed a green week. Meanwhile, the Nasdaq shed 4.48%, the Russell 2000 dropped 3.05%, and the market's favorite AI toys discovered that gravity still works.
QUICK SCAN: Open any numbered section for what happened, why it matters, and the operator takeaway. Detailed methodology, data provenance, and citations are consolidated under VIEW RESEARCH, SOURCES & AEO EVIDENCE™.
01 THE WEEK IN REVIEW™THE GREEN DOW WAS THE DECOYExplore the Week 42 01 the week in review™ analysis, evidence, and operator takeaways.
01 THE WEEK IN REVIEW™ — THE GREEN DOW WAS THE DECOY
| Cash index (not ETF) | Oct 9 | Oct 16 | Friday | Week |
|---|---|---|---|---|
| Dow Jones Industrial Average | 51,654.95 | 52,002.41 | −0.34% | +0.67% |
| S&P 500 | 7,811.54 | 7,659.44 | −1.09% | -1.95% |
| Nasdaq Composite | 27,366.17 | 26,140.03 | −2.15% | -4.48% |
| Russell 2000 | 2,806.98 | 2,721.37 | −1.66% | -3.05% |
The Dow finished up 0.67% for the week while the Nasdaq lost 4.48%. That 5.15-percentage-point divergence is the story, not an incidental footnote. The Russell 2000 posted another weekly decline as smaller companies remained exposed to expensive financing and a deteriorating risk appetite. Technology led the downside; the retreat in longer-term yields did not immediately rescue the AI trade.
OPERATOR READ™: The index can be green while your actual opportunity set is shrinking. Price tells you what happened. Relative strength tells you where leadership moved. Credit tells you whether that move can survive.
02 WEEKLY MARKET INTERNALS™THE CANARY WAS THE RUSSELLExplore the Week 42 02 weekly market internals™ analysis, evidence, and operator takeaways.
02 WEEKLY MARKET INTERNALS™ — THE CANARY WAS THE RUSSELL
FRIDAY CLOSE — MARKET INTERNALS DASHBOARD™
01 / VOLATILITY & PRICE OF MONEY™
| Market internal | Friday close | Operator read |
|---|---|---|
| VIX · Cboe Volatility Index | 19.98 | Up 34.64% from 14.84 last Friday — fear rose sharply. |
| VVIX · VIX volatility | 109.91 | Elevated volatility-of-volatility: use extra caution with hedging and position sizing. |
| MOVE · Treasury volatility | 101.11 | Bond volatility rose from 98.47 to 101.11 (+2.68%) — rates remain a risk signal. |
| 2-Year Treasury | 4.715% | Front-end rate expectations; 10Y–2Y spread: +38.3 bp. |
| 10-Year Treasury | 5.098% | Down from 5.244% Oct. 9 (−14.6 bp); lower yields amid weaker stocks can indicate demand for safety. |
| 30-Year Treasury | 5.426% | Long-duration funding conditions; 30Y–10Y spread: +32.8 bp. |
02 / MOVING-AVERAGE MARKET BREADTH
| Indicator | Measure | Week 41 · Oct 9 | Week 42 · Oct 16 | Weekly change |
|---|---|---|---|---|
| MMTW | % above 20-day moving average | 38.67% | 40.12% | +1.45 pp |
| MMFI | % above 50-day moving average | 28.93% | 28.28% | −0.65 pp |
| MMTH | % above 200-day moving average | 43.34% | 41.51% | −1.83 pp |
THE BALD BULL READ™ — Week 42 was a split tape: MMTW rose to 40.12% (+1.45 pp), but MMFI slipped to 28.28% (−0.65 pp) and MMTH to 41.51% (−1.83 pp). VVIX at 109.91 and MOVE at 101.11 reinforce a higher-volatility regime, while the 10Y–2Y curve stood at +38.3 bp and the 30Y–10Y spread at +32.8 bp. SPY traded 64.38 million shares Friday. VIX closed at 19.98, up 34.64% from 14.84 the prior Friday. WATCH THE PRICE OF MONEY.™ WATCH THE BREADTH. TRADE THE CONFIRMATION.™
Breadth: Moving-average breadth: MMTW 40.12% (+1.45 percentage points week over week), MMFI 28.28% (−0.65 points), and MMTH 41.51% (−1.83 points),. Fewer than three in ten measured stocks are above their 50-day average. Separately, seven of 11 Select Sector ETFs advanced; sector-ETF breadth is not stock-level breadth.
Volume: SPY traded 64.38 million shares Friday, October 16. A single day of volume does not establish accumulation or distribution.
Leadership: Consumer Staples (+5.02%) and Energy (+4.86%) led the working sector ranking; Technology (−7.70%) lagged. These are sector-ETF price returns,.
Volatility: VVIX 109.91 and MOVE 101.11; MOVE increased 2.64 points (+2.68%) versus Week 41 at 98.47. VIX closed at 19.98, up 5.14 points (+34.64%) versus 14.84.
Risk: Nasdaq Composite −4.48% and Russell 2000 −3.05% contrasted with Dow +0.67%; financing-sensitive leadership weakened despite a lower 10-year yield.
Operator Read: A green Dow cannot certify market health with only 28.28% of the measured universe above its 50-day average. Short-term breadth improved while intermediate- and long-term breadth deteriorated. VVIX 109.91, MOVE 101.11 and Friday SPY volume of 64.38M reinforce the need to watch confirmation, not assume a reversal. Treasury curve spreads were +38.3 bp (10Y–2Y) and +32.8 bp (30Y–10Y), based on the supplied Friday yields. Respect the No Trade Zone™. Read the Volume. Follow the Rotation. Trade the Turn.
RATES → CREDIT → LIQUIDITY → BREADTH → PRICE™
| Link | Verified read | Operator implication |
|---|---|---|
| Rates | 10-year Treasury yield 5.244% Oct 9 → 5.098% Oct 16, −14.6 basis points (source-series difference; providers vary by cutoff) | Falling yields can signal a flight to safety, not automatically growth-stock relief |
| Credit | Reuters reported CoreWeave bond yields above 15% amid AI-financing concerns | Watch funding stress before assuming equity weakness is merely a dip |
| Liquidity | U.S. equity funds +$13.01B in the reporting week ended Oct 14, but tech-sector funds −$5.21B | Real fund-flow evidence shows rotation within the market, not universal withdrawal |
| Breadth | 7 of 11 Select Sector ETFs gained. Publisher-supplied stock breadth: MMTW 40.12%, MMFI 28.28%, MMTH 41.51%. | Short-term breadth improved, but 50-day and 200-day breadth deteriorated; stock-level and sector-level universes differ. |
| Price | Nasdaq −4.48%, Russell −3.05%, S&P −1.95%, Dow +0.67% | The smallest and most duration-sensitive groups were less healthy |
| Volatility | VIX 14.84 Oct 9 → 19.98 Oct 16, +34.64% | Respect expanding volatility and widening stops |
THE RUSSELL 2000 LESSON™: The Russell is a small-cap index, not simply a regional-bank index. Regional banks are one interest-rate-sensitive component of its wider universe. When RUT weakens alongside credit stress, high yields and poor breadth, it can act as an early-warning signal. It is not a standalone crash predictor; use it with SPX, Nasdaq, sector breadth, Treasury yields and credit spreads.
03 SECTOR ROTATION READ™TOOTHPASTE BEAT TECHNOLOGYExplore the Week 42 03 sector rotation read™ analysis, evidence, and operator takeaways.
03 SECTOR ROTATION READ™ — TOOTHPASTE BEAT TECHNOLOGY
| Rank | Sector | Week 42 performance | Operator read |
|---|---|---|---|
| 1 | Consumer Staples (XLP) | +5.0% | Defensive leadership |
| 2 | Energy (XLE) | +5.0% | Energy outperformance |
| 3 | Health Care (XLV) | +3.4% | Health-care resilience |
| 4 | Materials (XLB) | +2.5% | Positive rotation |
| 5 | Utilities (XLU) | +2.0% | Relative strength |
| 6 | Financials (XLF) | +1.4% | Modest advance |
| 7 | Real Estate (XLRE) | +1.2% | Modest advance |
| 8 | Industrials (XLI) | −0.9% | Selling pressure |
| 9 | Communication Services (XLC) | −1.6% | Growth-adjacent weakness |
| 10 | Consumer Discretionary (XLY) | −1.9% | Consumer cyclicals weaken |
| 11 | Information Technology (XLK) | −6.4% | Sharpest sector drawdown |
SECTOR LEADERS™: Staples +5.0% • Energy +5.0% • Health Care +3.4% • Materials +2.5% • Utilities +2.0%.
SECTOR LAGGARDS™: Technology −6.4% • Consumer Discretionary −1.9% • Communication Services −1.6% • Industrials −0.9%.
04 CRYPTO CORNER™FOLLOW BITCOIN, NOT THE HYPEExplore the Week 42 04 crypto corner™ analysis, evidence, and operator takeaways.
04 CRYPTO CORNER™ — FOLLOW BITCOIN, NOT THE HYPE
CRYPTO PULSE™ — Regime
Risk-off, Bitcoin-led defense. Crypto traded like a liquidity-sensitive risk asset as growth stocks cracked. The October 16 figures below are intraday UTC snapshots, not final 24-hour Friday closes; crypto does not observe the U.S. stock-market closing bell.
CRYPTO CHARTS — WEEK 42
CRYPTO SEASONALITY™
KEY MOVES™
- Bitcoin: approximately $81,620 at the October 16 Yahoo snapshot, after a volatile week.
- Bitcoin downside test: the October 15 intraday low was approximately $79,736 on Yahoo; LSEG/Barron’s independently described a four-week low near $79,770.
- Ethereum: approximately $2,420 at the October 16 snapshot versus an October 9 UTC daily close near $2,486. Those are not matched Friday 4 p.m. ET snapshots.
- Spot Solana ETF demand: U.S. Solana ETFs recorded $24.8 million in net outflows for the week ended October 9, breaking a reported 14-week inflow streak; this is prior-week evidence, not a claim about October 16 flows.
- Macro transmission: Bitcoin was reported around $82,000 as the tech selloff and rate uncertainty intensified on October 16; this was not a confirmed breakout.
BALD BULL READ™
THE SEASONALITY SETUP™ — October’s historical seasonal pattern points to the possibility of a fall rally, with a potential year-end extension. But a seasonal tendency is a setup, not a buy signal. The debt and credit markets can still put the brakes on Bitcoin, especially where leveraged treasury strategies depend on financing costs, collateral values, and continued access to capital. Higher yields and tighter credit can turn a promising seasonal tailwind into a headwind.
THE BALD BULL READ™ — The calendar says opportunity. The credit market says prove it. Keep BTC, COIN, and HOOD on the pin-action watchlist as fall progresses. Look for BTC to reclaim and hold key price levels, COIN and HOOD to show relative strength, and improving participation alongside calmer yields and credit conditions. If price, breadth, and liquidity confirm together, a rally into year-end becomes a tradeable possibility. If they do not, respect the No Trade Zone™. Seasonality sets the stage. Price action gives permission.™
NOW WHAT™
Rates → dollar → spot ETF flows → BTC $79.7K support / $82.7K October 16 high → ETH confirmation → altcoin breadth. FOLLOW WHERE BITCOIN MOVES THE MONEY.™
05 TOP 5 CATALYSTS OF THE WEEK™Explore the Week 42 05 top 5 catalysts of the week™ analysis, evidence, and operator takeaways.
05 TOP 5 CATALYSTS OF THE WEEK™ — WHAT MOVED THE MONEY
TOP 5 CATALYSTS SUMMARY — WEEK 42
#1 — AI FINANCING MET THE DISCOUNT RATE
WHAT? AI-linked technology and chip shares fell sharply; Reuters flagged distressed-looking CoreWeave debt, and IBD reported an extended semiconductor losing streak. SO WHAT? The market is separating exciting revenue stories from the cost of financing the infrastructure behind them. NOW WHAT? Track SOXX/SOX, CRWV debt signals, hyperscaler capex guidance and the next earnings wave. BALD BULL READ™: The bill for the AI party arrived before the cake.
#2 — THE PRICE OF MONEY™ FELL. RISK STILL ROSE.
WHAT? The 10-year Treasury yield moved from about 5.244% to 5.098% across the two Fridays while stocks sold off. SO WHAT? A falling yield can mean investors are seeking shelter, not that everything is suddenly cheap. NOW WHAT? Watch Treasury auctions, inflation expectations, the dollar, credit spreads and the October 28 Fed decision window. BALD BULL READ™: A lower yield doesn't automatically repair a broken balance sheet.
#3 — OIL / IRAN: THE ENERGY HEDGE WASN’T BORING
WHAT? Middle East supply concerns helped push crude prices higher, and XLE advanced 4.86% over the week. SO WHAT? Energy strength can coexist with weakness in growth and consumer-sensitive groups; inflation and geopolitical risk are two different knives. NOW WHAT? Watch Brent/WTI, tanker headlines, the dollar and whether energy breadth confirms. BALD BULL READ™: Geopolitics doesn't read your options expiration date.
#4 — SPACE ECONOMY: LAUNCH SUCCESS, LAUNCH DELAY, SHAREHOLDER PAIN
WHAT? Rocket Lab's October 14 company release moved Neutron's first-launch target to 2027; separately, SpaceX completed a Falcon 9 Starlink mission on October 12. SpaceX's listed common shares (Nasdaq: SPCX, trading since June 12) fell 10.17% Friday-to-Friday. SO WHAT? RKLB's development setback and SPCX's weekly price decline are distinct facts; do not claim SpaceX's successful launch caused the decline. NOW WHAT? Compare RKLB, SPCX, ASTS, FLY and RDW on dated launch/contract news, verified liquidity and price confirmation. BALD BULL READ™: Rockets have countdowns. Risk management should too.
#5 — THE FLOW REPORT EXPOSED A SPLIT MARKET
WHAT? Reuters reported $13.01 billion of U.S. equity-fund inflows for the week ended October 14, alongside $5.21 billion of technology-sector outflows. SO WHAT? Money can enter equities overall while exiting a crowded leadership trade. NOW WHAT? Compare actual fund-flow windows with sector price strength; do not confuse them. BALD BULL READ™: The market didn't run out of money. It changed the guest list.
06 TOP 5 TRADES OF THE WEEK™THE CATALYST TRADE READ™THE MARKET LEFT CLUES ALL WEEK. DID YOU SEE THEM? Study XLP, XLE, SMCI, SPCX, TSLA + bonus CRWV to prepare for Week 43.
06 TOP 5 TRADES OF THE WEEK™ — THE CATALYST TRADE READ™
THE MARKET LEFT CLUES ALL WEEK. DID YOU SEE THEM—OR DID YOU PAY TUITION TO WALL STREET AGAIN?
While most investors were chasing headlines, disciplined operators were studying the evidence. Five trades exposed where money was moving, where momentum was breaking, and where Wall Street’s favorite stories collided with price action.
THIS WEEK’S FIVE FEATURED TRADES:
- #1 — XLP: The Grocery Aisle Won the Vote — Defensive money takes control.
- #2 — XLE: Oil Got the Last Word — Energy strength reveals the rotation.
- #3 — SMCI: The AI Hardware Trapdoor — When the AI narrative meets selling pressure.
- #4 — SPCX: The Rocket Launched. The Stock Didn’t. — Space-economy hype meets market reality.
- #5 — TSLA: The Roadster Met the Earnings Clock — Catalyst anticipation meets price action.
- BONUS — CRWV: The AI Bounce Watch™ — Recognizing a potential reversal without catching a falling knife.
Go behind the moves with trade breakdowns, charts, catalysts, confirmation signals, and Trade DNA™ analysis. Discover what triggered each setup, where buyers and sellers took control, what the charts revealed, and—more importantly—when NOT to trade.
WHY DOES THIS MATTER FOR WEEK 43?
Because Friday’s charts can become Monday’s roadmap. Study critical price levels, potential reversals, sector rotation, and emerging risks to build a smarter watchlist for the week ahead.
The most expensive trade isn’t always the one you lose. It’s the opportunity you never learned to recognize.
Don’t trade last week’s headlines. Learn to read next week’s opportunities.
Catalyst creates the move. Confirmation gives permission.™
These are educational, conditional watch setups—not verified executed trades or guaranteed outcomes. All setups require confirmation.
#1 — XLP: THE GROCERY AISLE WON THE VOTE
WHAT? Staples advanced +5.02% Friday-to-Friday while the Nasdaq fell 4.48%.
SO WHAT? When people stop chasing chips and start buying toothpaste, leadership has changed.
NOW WHAT? Watch a hold above Friday’s range rather than chasing the candle.
BALD BULL READ™: Boring can be beautiful when volatility gets expensive.
TRADE DNA CARD™ — XLP
| Field | Operator read |
|---|---|
| Direction | LONG — conditional continuation |
| Friday Close | $87.62 (Oct 16, 2026) |
| Key Session Move(s) | Friday +1.08%; week +5.02%; Friday range $87.19–$87.86 |
| Approx. Two-Day Move | +1.81% (Oct 14 close → Oct 16 close, two sessions) |
| Primary Catalyst | Defensive rotation into consumer staples while AI shares sold off |
| Trade Setup | Momentum continuation after a five-session defensive advance |
| Ideal Entry | Hold a retest of $87.19–$87.34, or a clean break/retest above $87.86 |
| Confirmation | Price accepts above $87.86 with SPY stabilization and XLP relative strength |
| Ideal Strategy | Defined-risk bullish call debit spread only after option-chain/liquidity check |
| Invalidation | Sustained move below $86.60; tighter trigger failure below $87.19 |
| Market Environment | Risk-off rotation; do not mistake defensive relative strength for a market-wide all-clear |
| Trade Grade | B+ / conditional (subjective setup quality, not a performance forecast) |
| 1K WAY™ Setup | Catalyst → 3D trend/retracement/trade alignment → vertical decision line → draw stop first |
#2 — XLE: OIL GOT THE LAST WORD
WHAT? Energy gained +4.86% for the week and +2.52% Friday.
SO WHAT? The price of oil can reprice a sector faster than an analyst can update a spreadsheet.
NOW WHAT? Require a hold above $68.29 or a controlled retest.
BALD BULL READ™: A geopolitical headline is not a stop-loss strategy.
TRADE DNA CARD™ — XLE
| Field | Operator read |
|---|---|
| Direction | LONG — conditional breakout |
| Friday Close | $68.24 (Oct 16, 2026) |
| Key Session Move(s) | Friday +2.52%; week +4.86%; Friday range $67.01–$68.29 |
| Approx. Two-Day Move | +0.90% (Oct 14 close → Oct 16 close, two sessions) |
| Primary Catalyst | Middle East supply risk and a renewed oil-price surge |
| Trade Setup | Sector relative-strength continuation after Friday expansion |
| Ideal Entry | Retest/hold $67.01–$67.11 or break/retest above $68.29 |
| Confirmation | XLE holds above $68.29 with oil firm and broad energy participation |
| Ideal Strategy | Defined-risk bullish call vertical; avoid chasing geopolitical gaps |
| Invalidation | Sustained break below $66.17 (Oct 15 low) |
| Market Environment | Geopolitical headline and weekend gap risk; use smaller size |
| Trade Grade | B+ / headline-risk (subjective setup quality, not a performance forecast) |
| 1K WAY™ Setup | Catalyst → confirmation in energy breadth and oil → measured entry → predefined exit |
#3 — SMCI: THE AI HARDWARE TRAPDOOR
WHAT? SMCI lost 24.44% Friday-to-Friday, including 9.86% Friday.
SO WHAT? The AI story did not disappear; the market changed what it was willing to pay for it.
NOW WHAT? Trade a failed reclaim, not the bottom of a vertical slide.
BALD BULL READ™: A falling knife is not a discount coupon.
TRADE DNA CARD™ — SMCI
| Field | Operator read |
|---|---|
| Direction | BEARISH — failed-reclaim or breakdown |
| Friday Close | $31.63 (Oct 16, 2026) |
| Key Session Move(s) | Friday −9.86%; week -24.44%; Friday range $31.43–$34.62 |
| Approx. Two-Day Move | -11.60% (Oct 14 close → Oct 16 close, two sessions) |
| Primary Catalyst | Broad AI infrastructure financing and valuation de-risking; company-specific catalyst not isolated |
| Trade Setup | Trend breakdown after a −24.44% week; avoid chasing exhaustion |
| Ideal Entry | Failed reclaim of $34.47–$34.62, or break/retest below $31.43 |
| Confirmation | Rejection at resistance, downside breadth and renewed heavy turnover |
| Ideal Strategy | Defined-risk bearish put debit spread after IV/spread check; no naked short required |
| Invalidation | Sustained reclaim above $35.12 (Oct 15 high) |
| Market Environment | High-volatility downside momentum; bounce/squeeze risk elevated |
| Trade Grade | B / confirmation required (subjective setup quality, not a performance forecast) |
| 1K WAY™ Setup | Trade the turn or failed retracement; respect No Trade Zone™ during whipsaw |
#4 — SPCX: THE ROCKET LAUNCHED. THE STOCK DIDN’T.
WHAT? Nasdaq-listed SpaceX (SPCX) fell 10.17% this week despite a successful Falcon 9 Starlink mission.
SO WHAT? Rockets follow physics; stocks follow buyers and sellers.
NOW WHAT? Watch $142.96 support and $147.92 reclaim resistance.
BALD BULL READ™: Mission accomplished does not mean shareholder profits delivered.
TRADE DNA CARD™ — SPCX
| Field | Operator read |
|---|---|
| Direction | BEARISH — relative weakness watch |
| Friday Close | $146.03 (Oct 16, 2026) |
| Key Session Move(s) | Friday −1.74%; week -10.17%; Friday range $142.96–$147.92 |
| Approx. Two-Day Move | -4.03% (Oct 14 close → Oct 16 close, two sessions) |
| Primary Catalyst | SpaceX Falcon 9 Starlink launch Oct 12 succeeded; broader space-sector repricing; direct price causality unverified |
| Trade Setup | Failed rebound after −10.17% week in a liquid listed space operating company |
| Ideal Entry | Failed reclaim near $147.82–$147.92 or break/retest below $142.96 |
| Confirmation | Rejection at Friday high or accepted trade below $142.96 with broader space weakness |
| Ideal Strategy | Defined-risk bearish put vertical; check spreads and gap risk |
| Invalidation | Sustained reclaim above $149.04 (Oct 15 high) |
| Market Environment | Space headline volatility; distinguish successful missions from share performance |
| Trade Grade | B / event-divergence (subjective setup quality, not a performance forecast) |
| 1K WAY™ Setup | Separate catalyst from confirmation; use 3D chart alignment and a No Trade Zone™ |
SPACE ECONOMY RUNNER-UP™ — RKLB · ROCKET LAB
SPACE ECONOMY RUNNER-UP™ — RKLB: Rocket Lab remains on the space-economy watchlist following the Neutron delay. Watch for price stabilization, a confirmed reversal, and sector participation before considering a setup.
#5 — TSLA: THE ROADSTER MET THE EARNINGS CLOCK
WHAT? Tesla declined 7.31% this week and closed at $354.72, with Q3 earnings due Wednesday.
SO WHAT? A product reveal is theater; margins, cash flow and guidance write the sequel.
NOW WHAT? Let the earnings gap settle before selecting a direction.
BALD BULL READ™: The market charges admission for guessing the ending.
TRADE DNA CARD™ — TSLA
| Field | Operator read |
|---|---|
| Direction | BEARISH / TWO-SIDED POST-EARNINGS WATCH |
| Friday Close | $354.72 (Oct 16, 2026) |
| Key Session Move(s) | Friday −2.13%; week -7.31%; Friday range $349.33–$370.50 |
| Approx. Two-Day Move | -3.39% (Oct 14 close → Oct 16 close, two sessions) |
| Primary Catalyst | Roadster reveal amid growth-stock weakness; Q3 earnings scheduled Oct 21 |
| Trade Setup | Pre-earnings breakdown watch; prefer post-report confirmation |
| Ideal Entry | After earnings: failed reclaim of $354.72–$370.50, or controlled reversal after a reclaim |
| Confirmation | Opening range, VWAP and post-earnings price acceptance; verify new earnings data |
| Ideal Strategy | Defined-risk vertical only after earnings/IV reset; otherwise no trade |
| Invalidation | For bearish setup, sustained acceptance above $370.50; reassess after earnings gap |
| Market Environment | High earnings gap and implied-volatility risk |
| Trade Grade | C+ / event risk (subjective setup quality, not a performance forecast) |
| 1K WAY™ Setup | Draw the event line; if no clean confirmation, a NO TRADE is a trade |
BONUS TRADE — CRWV: THE AI BOUNCE WATCH™
THE AI TRADE ISN’T DEAD. BUT THE MARKET HAS STOPPED HANDING OUT PARTICIPATION TROPHIES. CoreWeave sits at the intersection of AI infrastructure demand, capital-intensive expansion, and the price of money. This is a conditional bounce watch, not a completed winning trade.
WHAT? CRWV fell from its October 9 close of $82.08 to $61.39 on October 16 — approximately −25.2% for the week. Thursday briefly broke support near $59.51 before rebounding to close at $69.69; Friday’s renewed selling showed buyers had not yet secured control.
SO WHAT? The AI infrastructure thesis remains, but the cost of financing it matters. A heavy debt load, higher borrowing costs, and credit-market pressure can force investors to demand a bigger discount. A steep selloff can create a rebound opportunity — or signal genuine repricing of financial risk.
NOW WHAT? Watch $59.51–$59.90 as the recent-low support zone, $66–$70 for an initial reclaim, and $70–$72 for overhead resistance. Look for a higher low, sustained price acceptance above resistance, improving volume, AI-sector leadership, and calmer credit spreads. Reference zones are not guaranteed targets.
BALD BULL READ™: Wall Street spent billions convincing investors AI was the future. Then the bond market showed up with an invoice. Oversold is a condition, not permission. Don’t catch the knife. Trade the bounce. Catalyst creates the move. Confirmation gives permission.™
TRADE DNA CARD™ — CRWV BONUS BOUNCE WATCH
| Field | Operator read |
|---|---|
| Direction | CONDITIONAL BULLISH REVERSAL — only after confirmation |
| Primary Catalyst | Potential relief rally after AI-infrastructure and credit-driven repricing |
| Setup | Failed breakdown / higher-low reversal; no bottom-fishing |
| Support Watch | $59.51–$59.90 recent-low area |
| Initial Reclaim Zone | $66–$70; require price acceptance, not a brief spike |
| Overhead Resistance | $70–$72 |
| Confirmation | Higher low, volume participation, AI-sector relative strength, and stabilizing credit conditions |
| Invalidation | Failure to defend recent lows; reassess if the reversal structure breaks |
| Risk Plan | Defined-risk setup only after liquidity and option-pricing checks; size for elevated volatility |
| 1K WAY™ Operator Lesson | Draw it before you trade it.™ No confirmed turn? NO TRADE IS A TRADE.™ |
THE SETUP: Trade the turn. Not the hope.™
07 THE WEEK AHEAD™CATALYST CALENDAR | OCTOBER 19–23, 2026Open the complete Week 43 Week Ahead embed: weekly read, calendar, Big Four, earnings, seasonality charts, and operator takeaways.
08 S.W.O.T.™THE OPERATOR’S BOARDExplore the Week 42 08 s.w.o.t.™ analysis, evidence, and operator takeaways.
08 S.W.O.T.™ — THE OPERATOR’S BOARD
| Quadrant | Evidence | Action |
|---|---|---|
| S — Strengths | XLP, XLE, XLV relative leadership; Dow positive for week | Follow confirmed leaders, not index nostalgia |
| W — Weaknesses | Nasdaq −4.48%, Russell −3.05%, XLK −7.70%, VIX higher | Tighten process; reduce impulsive growth exposure |
| O — Opportunities | Defensive momentum; failed-reclaim setups in AI; post-earnings repricing | Wait for measured retests and clean confirmation |
| T — Threats | Oil shock, expensive capital, AI credit stress, TSLA/META gap risk | Define invalidation before entry; never average a thesis |
S — Strengths
The tape did leave a few sturdy handholds. XLP, XLE and XLV showed relative leadership while the Dow finished the week positive, a reminder that capital was still finding places to work even as growth-heavy areas struggled. TFT reads that as selective leadership, not an all-clear. Keep the leaders on the board, then require price to hold support and confirm follow-through before treating relative strength as a trade trigger.
W — Weaknesses
The weak side of the board is loud: the Nasdaq lost 4.48%, the Russell 2000 fell 3.05%, XLK dropped 7.70%, and volatility moved higher. That combination says risk appetite narrowed and fast growth exposure carried a bigger penalty. The operator’s response is to shrink the urgency, tighten risk, and stop confusing a lower price with a better setup. Let damaged charts reclaim key levels before they earn fresh capital.
O — Opportunities
Opportunity is showing up in the rotation and in the reset. Defensive momentum can offer cleaner relative structure, while failed-reclaim behavior in AI names may define risk more clearly than trying to catch the first bounce. Earnings repricing can also create new levels after the initial reaction settles. TFT’s rule is simple: map the level, wait for the retest, and act only when price confirms. A watchlist is useful; a forced entry is not.
T — Threats
The threat stack can travel together: an oil shock can revive inflation pressure, expensive capital raises the hurdle for long-duration stories, and AI credit stress can expose how much confidence was already priced in. TSLA and META also bring meaningful gap risk, where a stop may not control the exit price. Define invalidation before entry, size for the gap you cannot predict, and never average down just to defend a thesis. Protect the account first.
09 MARKET MEMORY™2022: WHEN THE DISCOUNT RATE BECAME THE TRADEExplore the Week 42 09 market memory™ analysis, evidence, and operator takeaways.
09 MARKET MEMORY™ — 2022: WHEN THE DISCOUNT RATE BECAME THE TRADE
In 2022, investors learned that growth stocks are not priced only on how fast earnings might grow. They are priced on the discount rate applied to those future earnings. Higher yields can compress multiples even when a company keeps selling more products. The present week's lesson is subtler: yields can fall after credit and growth concerns hit, while equities keep declining. That's why TFT reads the whole chain — rates → credit → liquidity → breadth → price — instead of worshiping one indicator.
MARKET MEMORY RULE™: When price and the macro narrative disagree, don't pick a favorite. Wait for confirmation.
10 F.R.E.E.DOM FACT™YOUR MONEY HAS A HURDLE RATE.™Explore the Week 42 10 f.r.e.e.dom fact™ analysis, evidence, and operator takeaways.
10 F.R.E.E.DOM FACT™ — YOUR MONEY HAS A HURDLE RATE.™
The 10-year Treasury yield was about 5.098% at the October 16 close in the cited yield series. At that yield, $100,000 × 5.098% = $5,098 is a useful annualized benchmark calculation before taxes and costs, not a promised coupon or a guaranteed one-year profit from buying a bond fund. The actual yield on an individual Treasury depends on purchase price, maturity, reinvestment and holding period.
THE QUESTION™: If capital has an opportunity cost near 5.1%, why are you accepting undefined risk for a trade you can't explain?
Watch the price of money.™
11 MINDSET MOMENT™A NO TRADE IS A TRADEExplore the Week 42 11 mindset moment™ analysis, evidence, and operator takeaways.
11 MINDSET MOMENT™ — A NO TRADE IS A TRADE
The hardest skill isn't buying the breakout. It's saying NO when your setup isn't there. The week handed out several expensive lessons to anyone confusing a familiar ticker with a safe entry. Record the opportunity. Review the setup. Release the missed candle. Reset your process.
STOP & LEARN™ — 4R's: Record → Review → Release → Reset. Galatians 6:9 reminds us not to grow weary in doing good. Consistency is built on disciplined repetition, not forcing a P/L screenshot.
“And let us not grow weary of doing good, for in due season we will reap, if we do not give up.”
GALATIANS 6:9
Measure your process before your profit. You profit or learn. And a disciplined no-trade can be your best decision of the week.
13 THE FINAL WORDTHE CANARY DIDN’T MISS THE MEMOThe Week 42 market read, Monday operator plan, and final word.
13 THE FINAL WORD — THE CANARY DIDN’T MISS THE MEMO
The Dow was green. The Nasdaq wasn't. Small caps weren't. Technology certainly wasn't. And the sectors that led were the ones people buy when they stop believing every growth story deserves a premium.
MONDAY OPERATOR’S CHECKLIST™
- ☐ Align the Trend, Retracement and Trade charts. Require 3D confirmation.
- ☐ Mark the catalyst time, Friday’s high and low, the opening range, and the price level that changes the thesis.
- ☐ Follow the chain: 10-year yield → credit stress → sector leadership → Russell breadth → SPY/QQQ price acceptance.
- ☐ Respect the No Trade Zone™. If price is trapped between levels, observation is the position.
- ☐ Before entry, define maximum option or spread risk, confirm liquidity, account for earnings gap exposure, and know the invalidation level.
MONDAY QUESTION™: Are you trading evidence, or trying to make Friday’s losses feel better?
The market is not obligated to reward your conviction. It rewards decisions that survive contact with reality.
DON’T MAKE MORE. MAKE MORE OF WHAT YOU MAKE.™
WHAT YOU DON’T KNOW CAN COST YOU. WHAT YOU REFUSE TO LEARN CAN COST YOU MORE.™
Make More. Live F.R.E.E.™
RESEARCH, SOURCES & AEO EVIDENCE™
RESEARCH, SOURCES & AEO EVIDENCE™
Market Question & TFT Framework
Canonical definition — Sector rotation: the relative change in market price leadership across industry and sector groups over a defined period.
TFT POINT OF VIEW™: Catalyst → Confirmation™ separates an information event from evidence that market participants have accepted its interpretation. Price, volume, breadth, and economically connected assets should confirm before the operator takes risk.
Primary framework: Catalyst → Macro/Policy Interpretation → Price of Money™ → Sector/Asset → Index → Breadth + Volume. Week 42 example: the SpaceX spectrum agreement raised perceived mobile-competition risk; related telecom and tower shares diverged. Verify breadth and next-session volume before treating the reaction as a trade signal.
AEO Answers™ — Questions the Market Is Asking
Why did the Dow rise while the Nasdaq fell? Their constituents and weights differ. In the Oct 9–16 window, defensive and traditional businesses held up better than technology, producing Dow +0.67% versus Nasdaq −4.48%.
Is the Russell 2000 mostly regional banks? No. It tracks a broad U.S. small-cap universe; regional banks are one rate-sensitive slice. Its −3.05% week was a risk-appetite warning, not a stand-alone recession forecast.
Does a falling 10-year yield mean tech must rebound? No. Yields may fall as investors seek Treasury safety while credit spreads and earnings expectations deteriorate.
Is SPCX actually SpaceX stock? Yes, as of October 16, 2026. SpaceX confirmed its Class A common shares began Nasdaq trading under SPCX on June 12, 2026. It is an operating-company share, not a thematic ETF. The ticker must still be reverified in every dated publication.
Are sector ETF gains proof of institutional inflows? No. Price return is not a flow measure. Use separately reported fund flows with matched windows.
Did a SpaceX launch cause the week’s space-stock moves? No completed Week 42 launch-to-price link was independently validated. The confirmed company-specific catalyst was the October 8 spectrum agreement; any further causal attribution remains an interpretation.
Should traders chase the strongest weekly stock? No. Define an entry, invalidation, confirmation, position risk, and suitable option liquidity and volatility first. This is education, not personalized investment advice.
METHOD / DATA LOCK / ASSUMPTIONS
- Market close cutoff: Friday, October 16, 2026 U.S. cash close. Week = raw price close October 9 → October 16; weekly return = 100 × (current / previous − 1). Holiday fallback would use the nearest prior trading session; not needed for these two Fridays.
- Index Pulse: actual cash DJIA, SPX, Nasdaq Composite and RUT, not DIA/SPY/QQQ/IWM substitutes. ETF values are listed separately only for tactical proxy comparisons.
- Sector universe: all 11 Select Sector SPDR ETFs. Price returns exclude distributions; provider histories describe split-adjusted raw closes. Independent corporate-action and secondary-provider audits are incomplete for some rows, so sector rank table is provisional.
- Theme universe: 12 previously established theme watchlists and complete dated membership not retrievable in this run; Space Economy/Launch watch scanned independently, but the full 13-theme equal-weight ranking is not computed. Do not manufacture a theme rank or top/bottom 3.
- Space watch: SpaceX (SPCX) is a verified listed operating company, Rocket Lab (RKLB) a separate listed operating company; ASTS, FLY and RDW require individual dated membership and price checks. Thematic ETFs and indirect proxies must be separately labeled. No mission-to-price causality asserted without evidence.
- Trade grades: subjective educational assessment of setup clarity and event risk; not model scores or a record of executed trades. RVOL, full options chains, institutional attribution and precise Monday triggers are unavailable; do not substitute Friday-on-Friday volume ratio for RVOL.
- Crypto: UTC date rows are not U.S. 4 p.m. ET closes and October 16 rows were live snapshots at the time of retrieval.
- Author / entity: Time Freedom Trading™ | Clinton James, founder and technology sales executive/trading educator. Educational commentary, not individualized investment advice.
- Related TFT content: The 7 Figure Way™ • The 1K WAY™ • Trader’s Triangle™ • Financial Flywheel™ • Consistency Code™ • No Trade Zone™ • GET F.R.E.E. Friday™.
Sector Rotation Week 42 table note: Sector Rotation Week 42 table uses rounded sector percentage readings transcribed from the publisher-provided sector performance graphic. These are graphic-level sector readings, not validated Friday-to-Friday Select Sector SPDR ETF closing prices. Consequently the previous ETF Oct 9/Oct 16 price columns were removed rather than inventing prices consistent with rounded graphic percentages.
Market internals provenance: October 16 VVIX (109.91), MOVE (101.11), 2-year Treasury (4.715%), 30-year Treasury (5.426%), SPY volume (64.38M), MMTW (40.12%), MMFI (28.28%), and MMTH (41.51%) were publisher-supplied; the 10-year yield (5.098%) came from the working report. VIX 19.98 was publisher-confirmed. Publisher-supplied observations are not independently verified. The displayed 10Y–2Y (+38.3 bp) and 30Y–10Y (+32.8 bp) spreads are calculated from those observations. Week-over-week breadth comparisons are percentage-point changes and assume a consistent universe and method.
PRIMARY AND DATED SOURCE REGISTER™
- Associated Press, October 16 cash-index closes and weekly changes: https://www.chron.com/business/article/how-major-us-stock-indexes-fared-friday-10-16-2026-22480844.php
- Reuters, October 16 equity close and AI financing concerns: https://www.reuters.com/business/wall-st-futures-mixed-tech-wobbles-again-tesla-gains-2026-10-16/
- Reuters, October 16 weekly U.S. fund flows: https://www.reuters.com/business/us-equity-funds-draw-renewed-inflows-treasury-yields-ease-2026-10-16/
- FT, October 16 tech and Treasury weekly context: https://www.ft.com/content/4c4f03f4-f878-4bd6-8128-5be7e3bb8ca1
- Rocket Lab-issued October 14 Neutron update (syndicated release): https://finance.yahoo.com/markets/stocks/articles/rocket-lab-provides-neutron-development-204000949.html
- SpaceX official June 15 Nasdaq listing confirmation: https://ir.spacex.com/updates/releases-details/2026/Space-Exploration-Technologies-Corp--Announces-Closing-of-Initial-Public-Offering-Including-Full-Exercise-of-Underwriters-Option-to-Purchase-Additional-Shares-2026-RgoR-Y1Vwh/
- Space.com, October 12 Falcon 9 Starlink mission report: https://www.space.com/space-exploration/launches-spacecraft/spacex-launches-falcon-9-starlink-mission-for-1st-time-in-more-than-3-weeks-photo
- StockTitan, October 19–23 earnings and economic calendar with issuer links: https://www.stocktitan.net/articles/earnings-calendar-week-of-october-19-2026
- Cboe VIX via Yahoo historical table: https://finance.yahoo.com/quote/%5EVIX/history/
- ICE MOVE historical data (October 16 unavailable): https://www.investing.com/indices/ice-bofaml-move-historical-data
- 10-year Treasury daily yield history: https://portfolio-terminal.com/markets/10-year-treasury-yield
- Yahoo historical raw price closes for XLP, XLE, SMCI, SPCX, TSLA: https://finance.yahoo.com/quote/XLP/history/ | https://finance.yahoo.com/quote/XLE/history/ | https://finance.yahoo.com/quote/SMCI/history/ | https://finance.yahoo.com/quote/SPCX/history/ | https://finance.yahoo.com/quote/TSLA/history/
- Yahoo Bitcoin/Ethereum dated snapshots: https://finance.yahoo.com/quote/BTC-USD/history/ | https://finance.yahoo.com/quote/ETH-USD/history/
- Barron’s, October 16 Bitcoin near four-week low: https://www.barrons.com/livecoverage/stock-market-news-today-101626/card/bitcoin-stabilizes-after-hitting-4-week-low-strategy-hit-by-move-to-exclude-it-from-indexes--UQKqmhnaM8S5ZIvdRmum
- Reported prior-week Solana ETF flow: https://finance.yahoo.com/markets/crypto/articles/solana-etfs-end-14-week-043519322.html
- IBD, October 16 chip weakness and longest losing streak: https://www.investors.com/news/technology/chip-stocks-continue-downward-streak-pricing-in-a-crash/
- IBD, October 16 cybersecurity weakness and earnings risk: https://www.investors.com/market-trend/stock-market-today/dow-jones-sp500-nasdaq-treasury-yields-tesla-stock-tsla-roadster/
- Source-level ETF close tables and status are included in the companion frozen CSV (11 GICS ETFs plus index ETFs and trade watch).
Additional Dated Source References
- SpaceX official IPO pricing June 11, 2026: https://ir.spacex.com/updates/releases-details/2026/Space-Exploration-Technologies-Corp--Announces-Pricing-of-Initial-Public-Offering/default.aspx?linkId=95
- Grain Management, Oct. 8, spectrum agreement: https://www.prnewswire.com/news-releases/grain-management-announces-definitive-agreement-to-sell-nationwide-800-mhz-spectrum-portfolio-to-spacex-302902974.html
- CMS, Oct. 8, 2027 MA Star Ratings: https://www.cms.gov/newsroom/fact-sheets/2027-medicare-advantage-part-d-star-ratings
- Humana, Oct. 9, 95% four-star-plus: https://policy.humana.com/news-and-resources/news-press/2026/humana-announces-improved-cms-star-ratings-with-95-percent-of
- BLS Oct. 2026 schedule: https://www.bls.gov/schedule/2026/10_sched.htm
- Federal Reserve October 2026 calendar: https://www.federalreserve.gov/newsevents/2026-october.htm
- TSMC Q3 earnings: https://investor.tsmc.com/english/quarterly-results/2026/q3
- Census indicators: https://www.census.gov/economic-indicators/c
- Rocket Lab Sept. 11 launch historical context: https://investors.rocketlabcorp.com/news-releases/news-release-details/rocket-lab-successfully-launches-16th-electron-mission-year
DISTRIBUTION ASSETS™
BEEHIIV — THE 3-MINUTE PRE-MARKET READ™ / WEEKEND TEASER
Subject: THE DOW WAS GREEN. THE CANARY WASN’T.
Preview: Nasdaq −4.48%. Russell −3.05%. Staples +5.02%. This isn't the rally the headline sold you.
A green Dow hid a fractured market. Tech cracked, small caps weakened, and the sectors that kept moving were staples and energy. This week's GET F.R.E.E.™ Weekend Report shows you the complete 11-sector rotation, the space-launch trap, and five conditional setups with entry, confirmation and invalidation. Know the Catalyst. Watch the Confirmation. Trade the Evidence. Read the full report before Monday's open. Make More. Live F.R.E.E.™
LINKEDIN — 75% LESSON / 25% CTA
The Dow finished GREEN this week. The Nasdaq fell 4.48%. The Russell 2000 fell 3.05%.
If you're still judging market health by a single index, you're looking at the dashboard with one eye closed.
The actual rotation: Consumer Staples +5.02%. Energy +4.86%. Technology −7.70%. The 10-year yield eased, but AI financing fears didn't. Even a successful rocket launch couldn't guarantee a rising space stock.
That's the difference between watching headlines and reading market internals: Rates → Credit → Liquidity → Breadth → Price.
If you're a six-figure earner serious about building a seven-figure Wealth Operating System™, the skill isn't predicting Monday. It's learning when the evidence gives permission — and when NO TRADE is the right trade.
Read this week's GET F.R.E.E.™ Weekend Report and learn to see the market in 3D. Make More. Live F.R.E.E.™
YOUTUBE / SEO / X
- SEO title: Russell 2000 Warning: Why the Dow Rose as Tech and Small Caps Fell | Week 42 Market Review
- Meta description: October 16, 2026 stock-market review: Dow vs Nasdaq and Russell 2000, 11-sector rotation, SpaceX/Rocket Lab catalysts, five Trade DNA™ setups and next week's earnings.
- Slug:
/blog/get-free-weekend-report-week-42-october-16-2026 - YouTube title: THE DOW WAS GREEN. THE MARKET WASN'T. | Week 42 GET F.R.E.E.™
- Thumbnail line: THE DOW LIED. THE RUSSELL WARNED.
- X hook 1: Dow +0.67%. Nasdaq −4.48%. Russell −3.05%. Your index headline forgot to mention the canary.
- X hook 2: SpaceX launched. SPCX fell 10.17% for the week. Catalyst creates the move. Confirmation gives permission.™
GRAPHICS — THREE SEPARATE 16:9 RENDER-READY SPECIFICATIONS (NOT RENDERED)
Graphics are intentionally withheld because the complete 13-theme dated membership/returns, full independent provider checks and Friday MOVE close are missing. Publishing attractive but numerically incomplete rotation graphics would violate the TFT data lock.
1 — TFT WEEKLY MARKET PULSE™: 16:9; premium black/navy dark-glass command center, restrained emerald/red, fine gold bull top-right. Freeze SPY $778.57 → $763.25 (-1.97%), QQQ $751.27 → $709.80 (-5.52%), DIA $516.11 → $519.10 (+0.58%), IWM $278.94 → $270.44 (-3.05%). VIX Yahoo/Cboe 14.84 → 19.98 (+34.64%) (publisher-confirmed). MOVE Oct 16: 101.11 (publisher-supplied). SPY strip may use five verified daily closes only: Mon 778.10, Tue 778.01, Wed 769.60, Thu 771.79, Fri 763.25; explicitly label "FIVE DAILY CLOSES — NOT INTRADAY".
2 — TFT WEEKLY SECTOR ROTATION MAP™: 16:9, same design; use the complete 11-sector audit table above only after independent close/corporate-action checks resolve UNVERIFIED rows. SPY five-daily-close strip as above. Exact vertical scale on both edges +30,+20,+10,0,−10,−20,−30%, same continuous horizontal gridlines and dominant zero. Bubble vertical center = exact unrounded weekly return; horizontal collision offset only. Emerald positives/red negatives. Disclose bubble radius r_px = 8 + 3 × sqrt(abs(weekly_return_pct)), same formula in both maps; max radius 32 px if needed, with clipping QA. Include true top three/bottom three from all 11, top five gainers, four genuine decliners (no invented fifth), all-11 ranking and grounded read.
3 — TFT TACTICAL THEMES ROTATION MAP™: 16:9, same layout and exact shared bubble axes/formula. Include Space Economy/Launch and all 12 previously approved themes only after dated ticker membership is retrieved. Default each theme's weekly performance to equal-weight arithmetic mean of all its verified members' Oct 9–16 price returns; don't use a handful of representative stocks. Include true top five stock gainers, five decliners, all 13 numeric theme ranks, per-theme true top/bottom three, tactical rotation read and data-methodology footer. NOT COMPUTABLE THIS RUN.
COMMON GRAPHIC FOOTER: “OCT 9–16, 2026 | RAW CLOSE PRICE RETURN, NOT TOTAL RETURN | VERIFIED SOURCE AUDIT REQUIRED | FOLLOW THE MONEY. TRADE THE ROTATION. GET F.R.E.E.™” and “BUBBLE SIZE = ABSOLUTE WEEKLY % CHANGE | VERTICAL POSITION = EXACT WEEKLY RETURN.” No stock-market figures, plot points, rankings or table labels may be generated by image AI; code-typeset from frozen verified CSV only. All three images remain unrendered until zero-miss QA passes.

HOUSING HEALTH MONITOR™
HOUSING ISN'T JUST REAL ESTATE. IT'S A READ ON THE PRICE OF MONEY.™
THE RATE HELD — AFFORDABILITY IS STILL TIGHT.
The 30-year fixed mortgage rate held at 7.40% for a second straight weekly reading. September existing-home sales rose 1.5% month over month, while remaining 2.2% below a year earlier. Inventory improved, but the mortgage rate and builder sentiment keep affordability under pressure.
MORTGAGE COSTS REMAIN ELEVATED.
Freddie Mac reported 7.40% on October 8 and again on October 15. The rate is a weekly survey reading, not a Friday market close. At this level, financing costs continue to weigh on purchasing power even as resale inventory improves.
September SAAR; ▼ 2.2% Y/Y. Inventory reached 1.60M units, equal to 4.8 months of supply. Median price: $417,500, ▲ 1.3% Y/Y.
Latest: August 2026. Total starts fell 2.6% M/M; single-family starts rose 7.6%. Permits: 1.394M, down 2.7% M/M. Mixed construction signal.
Latest: August 2026; ▼ 2.0% Y/Y. Inventory: 483K homes, or 8.5 months. Median price: $393,700, ▼ 5.8% Y/Y.
September builder confidence fell 3 points. 38% cut prices (average cut: 6%); 66% used sales incentives. Builder sentiment remains subdued.
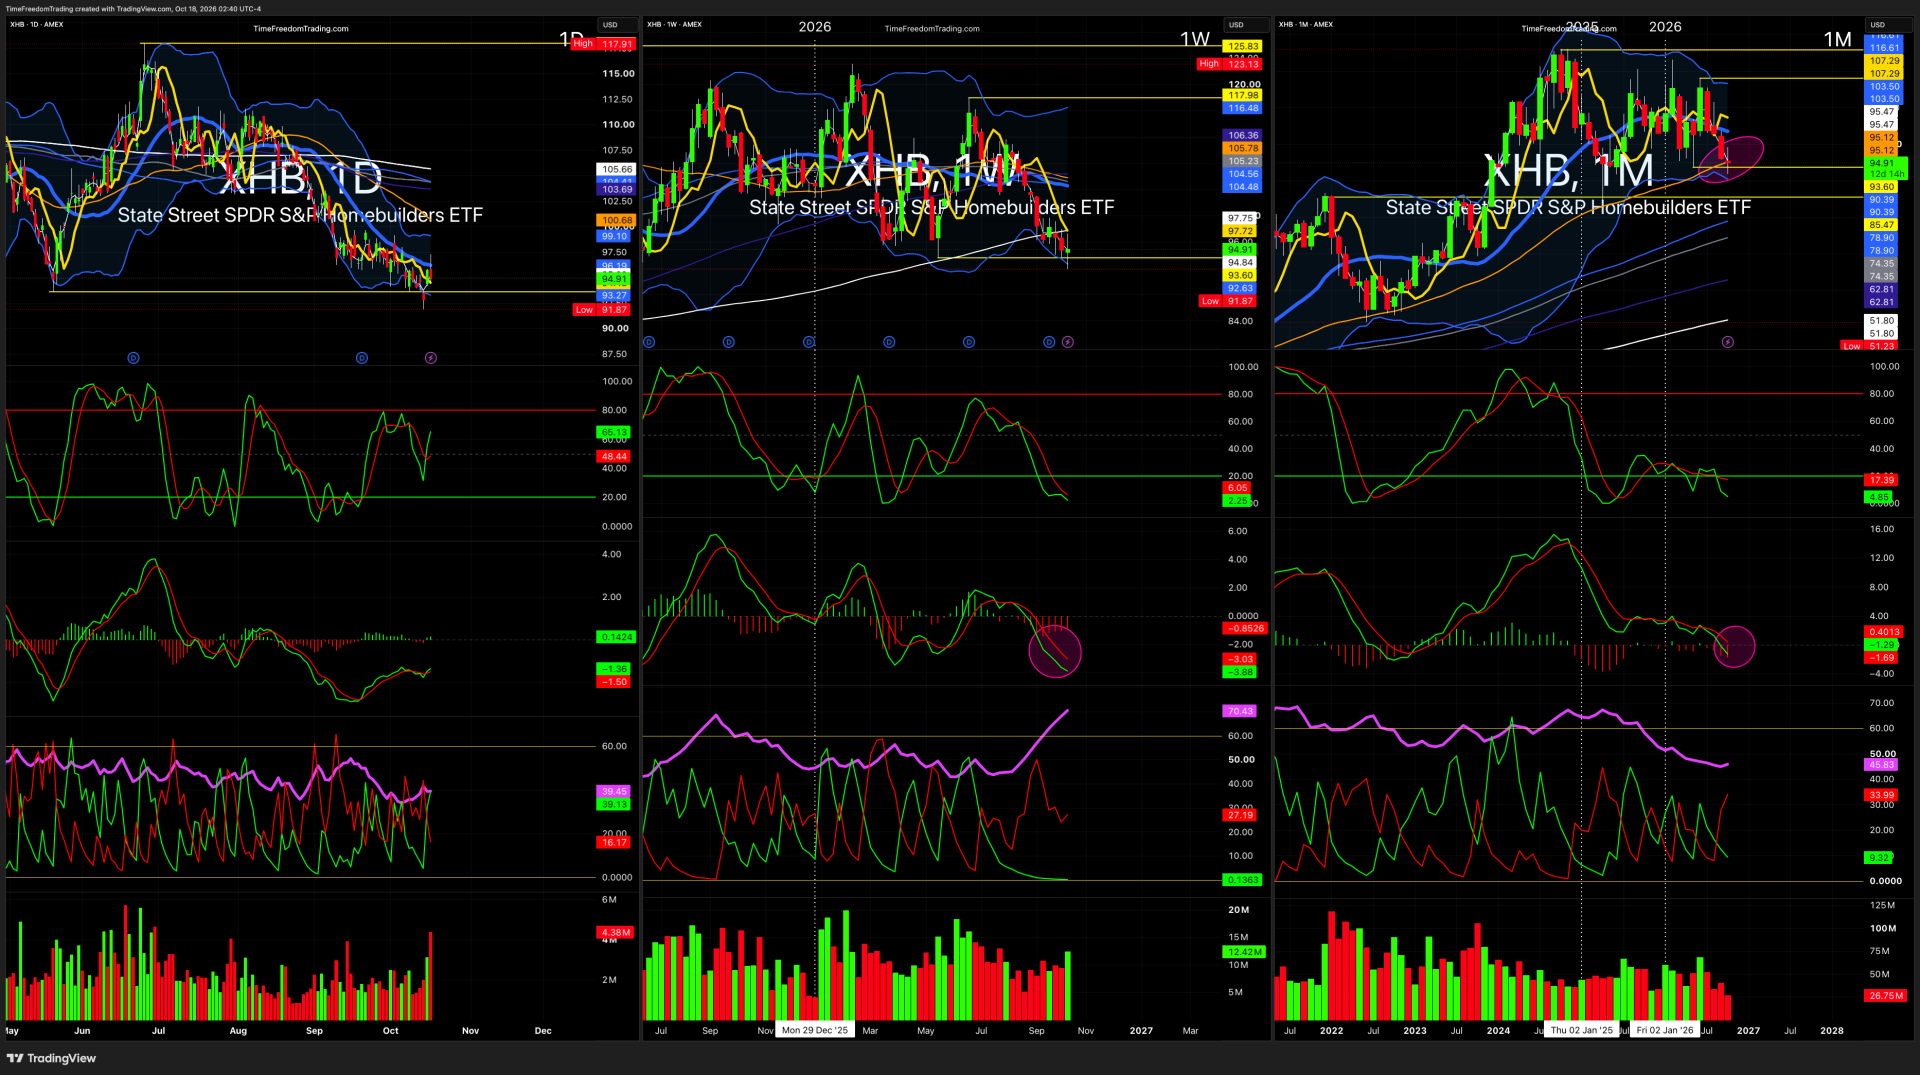
SPDR S&P Homebuilders ETF. Oct. 9 close: $94.77 → Oct. 16 close: $94.91. XHB finished modestly higher week over week; one weekly move does not establish a trend.
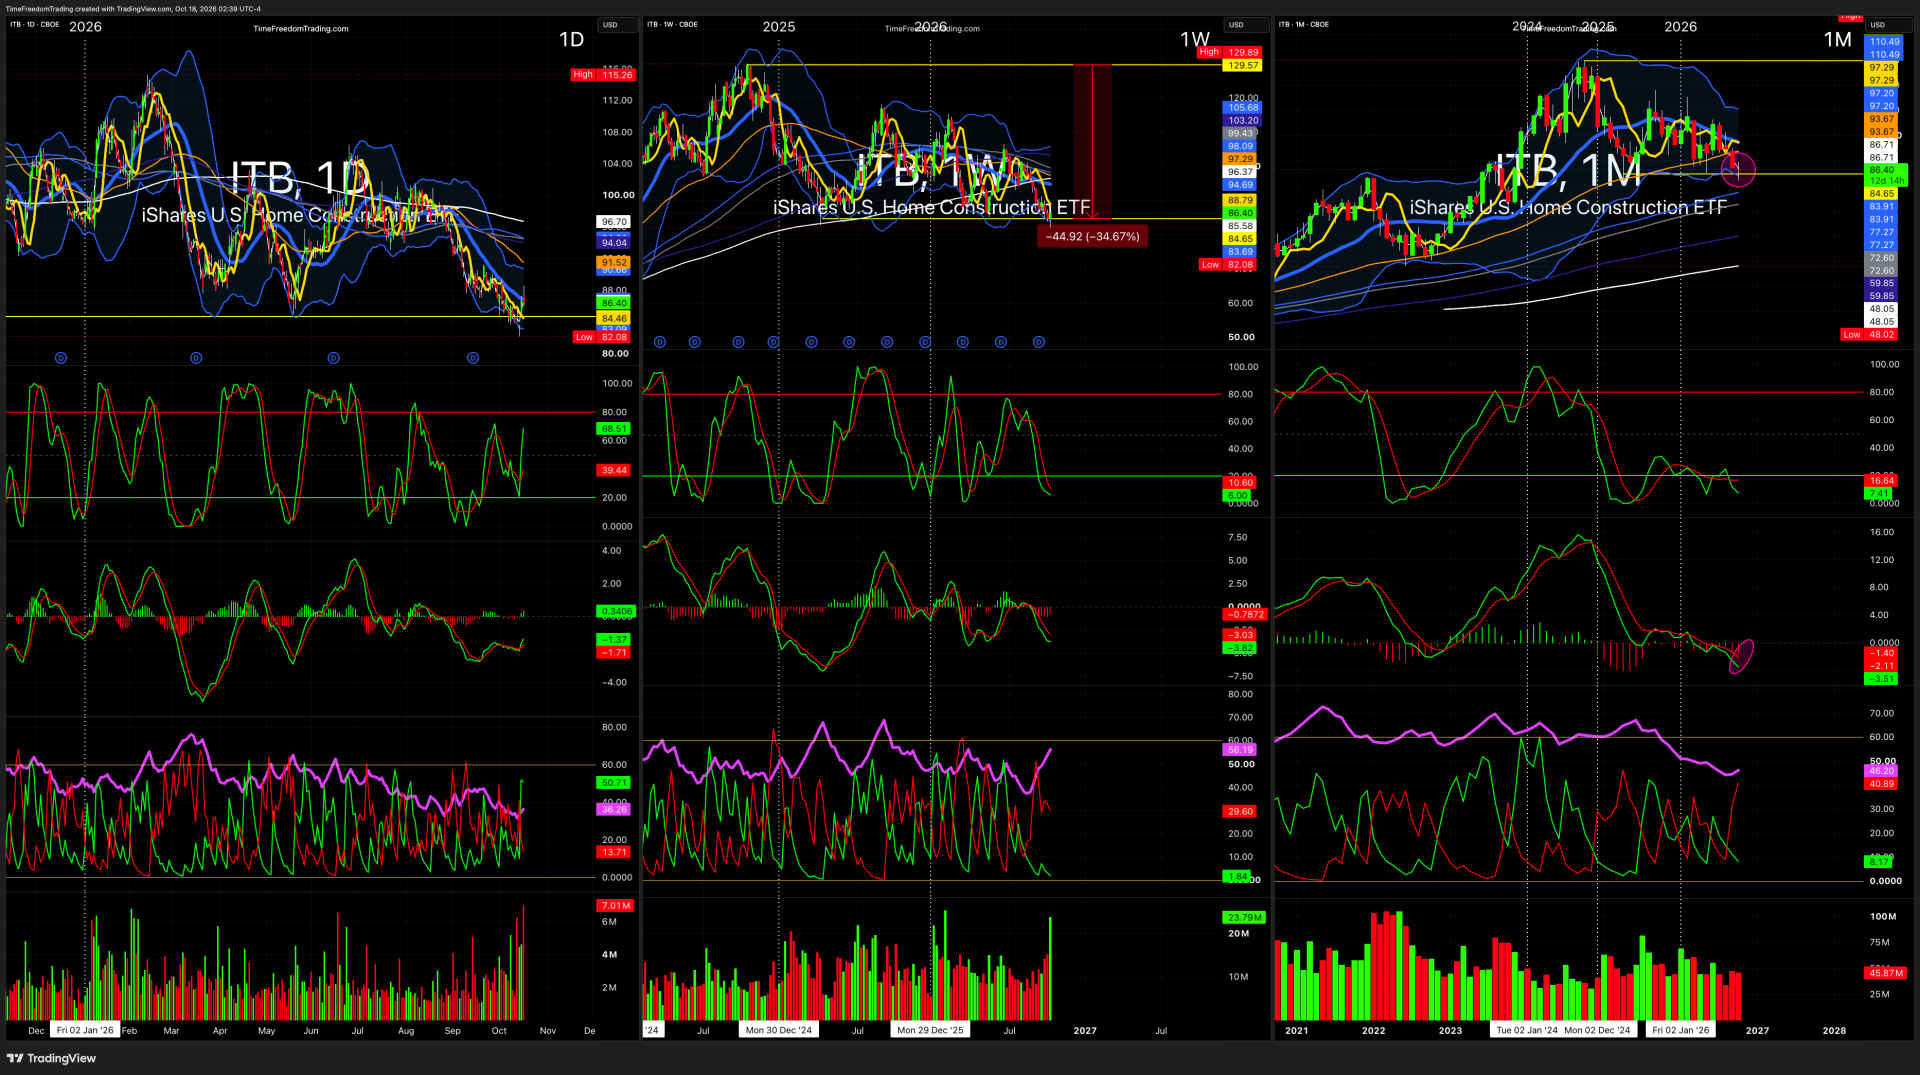
iShares U.S. Home Construction ETF. Oct. 9 close: $84.76 → Oct. 16 close: $86.40. ITB rose more than XHB over this window; this is price performance, not fund flows.
PRESSURE IS RISING — BUT THIS IS NOT 2008.
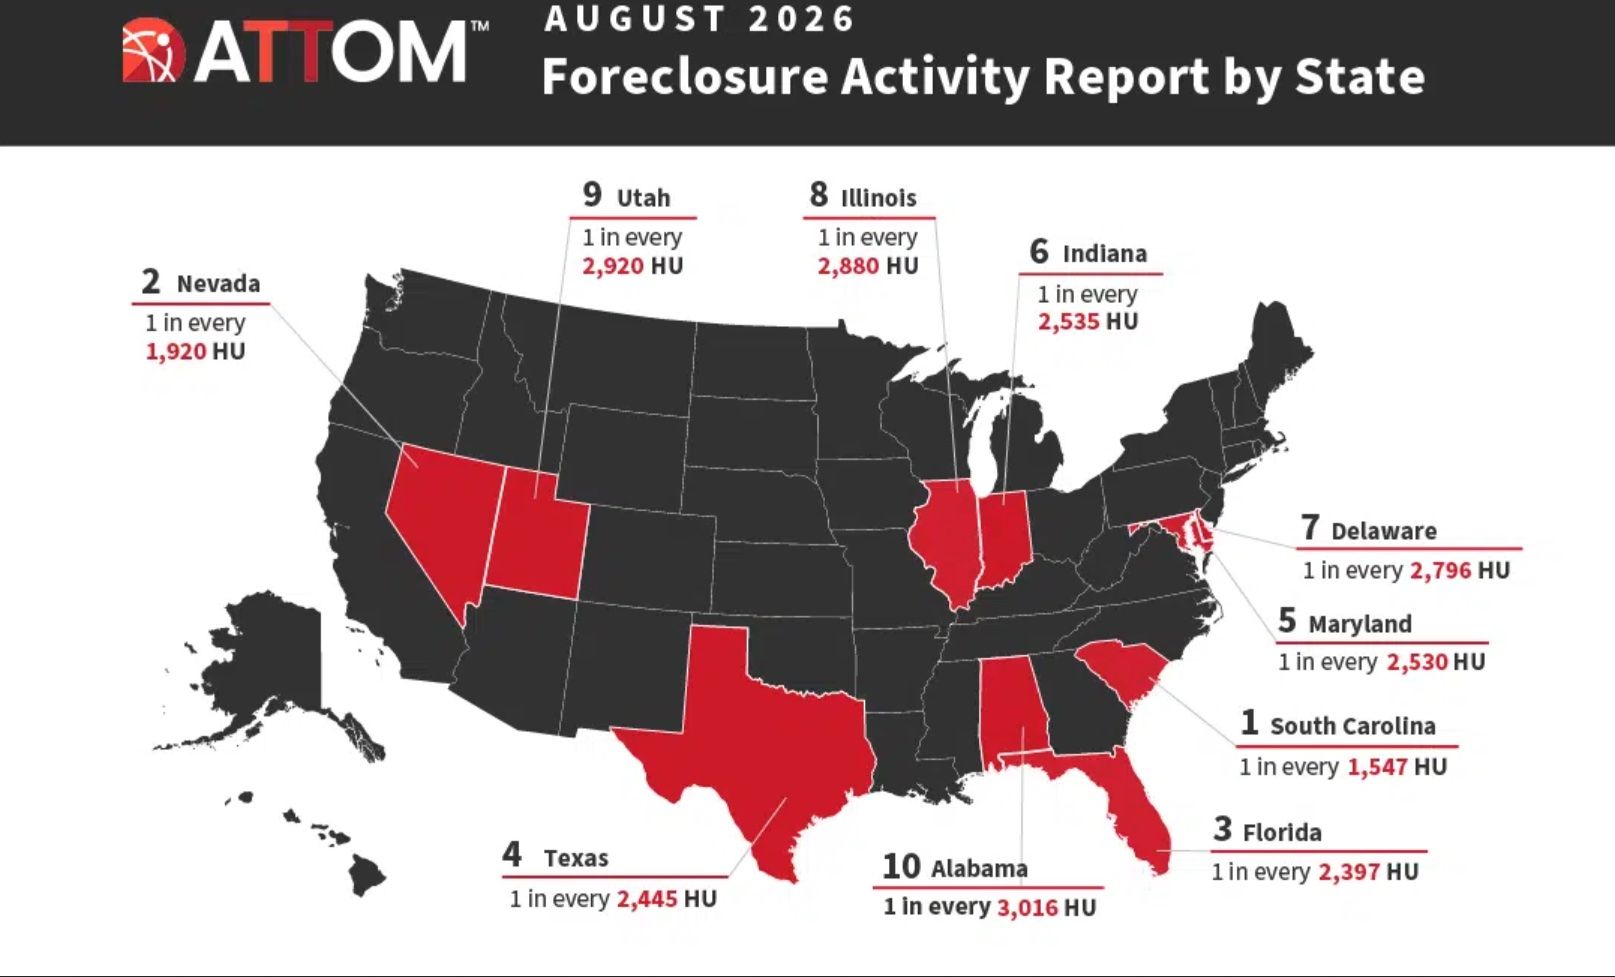
U.S. properties with foreclosure filings in August 2026.
Foreclosure activity versus August 2025.
Completed foreclosures / REOs versus one year earlier.
ATTOM's August 2026 report — the latest available by this cutoff — shows foreclosure activity running above year-ago levels, but total volumes remain below pre-pandemic norms. Translation: yellow warning light — not financial-crisis sirens.
WHERE IS FORECLOSURE PRESSURE SHOWING UP?
ITB
"Home Construction"
ETF
XHB
"Home Builders"
ETF

Want to
"SEE"
the Market
Correctly?
Get This Weeks
Key Earnings / Stock To Watch
in Tradingview

LIVE LIKE
A SUPER HERO!
A SUPER HERO!




10 TIME FREEDOM TRADING TACTICS YOU WILL LEARN!




When your ready;
There are five (5) ways I can help.

1.0 Subscribe to
The GET F.R.E.E. Report

2.0 Subscribe to
TIME FREEDOM TRADING TACTICS
3.0 The Time Freedom Trading
ON DEMAND COURSES
4.0 The Time Freedom Trading COACHING COHORT
5.0 The FREEDOM FRIENDS & FAMILY AFFILIATE PROGRAM



Register for the
FREEDOM FRIENDS & FAMILY
AFFILIATE PROGRAM!

The Get F.R.E.E.REPORT!

26 DECISIONS THAT WILL DECIDE YOUR 2026

#45 STOP PAYING IGNORANCE TAX

NEW YEAR: UNCERTAIN TIMES. CERTAIN EDGE.

#44 YOUR TRAINING YOUR AI REPLACEMENT.

#4 FIVE (5) REASONS EVERYONE SHOULD LEARN TO TRADE THE STOCK MARKET

# 38 FIVE YEARS FROM NOW, YOU'LL ARRIVE SOMEWHERE!

#40 Feeling FOMO for Missing the NVIDIA AI Bubble?
Share this Article on:
Learn to Earn Time Freedom;
FREE TO LIVE YOUR LIFE YOUR WAY!

Join us today
Join us today
Join us today
THANK YOU
Join us today
Join us today
Join us today

Learn to earn and earn time freedom with your profits in the stock market. Time Freedom Trading is helping MAIN STREET earn WALL STREET profits through real trading and investing strategies.
Forget the dogma of "set it and forget it" tactics with passive investing that keeps your advisor rich with fees and your account balance diminished with under performing portfolio strategies.
Time Freedom trading is helping MAIN STREET earn WALL STREET PROFITS. Can you afford to NOT find out? What is your old way of investing really costing you. Get started with TIME FREEDOM TRADING today!


THE BALD BULL READ™ — TOOTHPASTE BEAT TECHNOLOGY
Wall Street spent the week remembering something inconvenient: you can’t pay your electric bill with an AI valuation. Technology fell 6.4% in the sector-performance chart, while Staples and Energy each gained 5.0%. Health Care rose 3.4%, Materials added 2.5%, and Financials advanced 1.4%.
WHAT HAPPENED? Growth took the hit while essentials held their ground. The broad-market line finished the week down about 1.9%, and Thursday’s rebound failed to erase the week’s damage.
SO WHAT? That is rotation toward resilience, not an all-clear signal. A few strong defensive sectors can disguise a market with weak participation underneath.
NOW WHAT? Watch whether technology can regain leadership, whether defensive strength persists, and whether yields and breadth confirm the next bounce. Don't confuse rotation with recovery.
OPERATOR READ™: The market changed its shopping list. Read the leadership. Respect the No Trade Zone™. Catalyst creates the move. Confirmation gives permission.™