

TOP 10 PRE-MARKET MOVERS™

Confirmed: Jensen Huang has resigned and CFO Colette Kress is interim CEO. The frozen Top 10 graphic shows the earlier premarket quote snapshot, not a recalculated response to the announcement. Read the updated NVDA, CRWV and NBIS lessons below.
THE PRE-MARKET SETUP™
THE HEADLINE COOLED. THE CORE DIDN’T GET THE MEMO.
Wall Street walked into Friday looking for an inflation green light. It got a split decision instead. October producer prices advanced 0.3% from September, a touch below the 0.4% consensus. Then the core number arrived at 0.5%—above the 0.3% expected—and annual headline inflation reached 6.5%. A softer headline does not make the underlying pressure disappear. It means the market has two different stories to price before the opening bell.
That is the setup behind the ten companies below. Modine’s takeover speculation is negotiating a premium. Cerebras is being judged on earnings and its forward outlook. Microsoft is facing questions about enterprise reliability. And the chip complex is sorting company-specific catalysts from the much larger question: what is future AI growth worth when the price of money remains demanding?
The trap is to label every green candle “good news” and every red candle “bad news.” Stocks do not trade on adjectives. They trade on the difference between the future investors were paying for yesterday and the future they believe in today. The market can reward a company with imperfect results if expectations were worse—and punish another after an apparently strong quarter if the forecast fails to satisfy.
This is THE PRE-MARKET SETUP™: read the catalyst, understand the earnings or valuation mechanism, then demand confirmation from price. A headline gets attention. A durable change in expectations earns the move.
TOP 10 PRE-MARKET MOVERS™
MAGAZINE LESSONS FOR THE MORNING TAPE
01MOD — MODINE
Takeover discussions reported with Samsung · +30.3% reported premarket observation
MOD — MODINE

A takeover whisper can make an industrial stock move like a biotech lottery ticket. But an offer someone is discussing is not cash that a shareholder can deposit.
WHAT?
Modine drew buyers after reports of acquisition discussions involving Samsung. The early observation in this edition put the stock up 30.3%. That is the market pricing a potential change of ownership, not evidence that a definitive deal has been signed. The distinction matters more than the size of the green candle.
SO WHAT?
An acquisition can create a jump because the buyer may be willing to pay a control premium above the unaffected share price. Traders start estimating a bid price, the probability of completion, regulatory obstacles, financing, and what is left if discussions collapse. The lesson is deal probability: a stock trading below a rumored takeout price is not automatically a bargain. The gap may be compensation for the possibility that the transaction never happens.
NOW WHAT?
Watch for a company filing or a formal statement rather than treating market chatter as a binding contract. On the tape, mark the premarket high and the first opening range. If volume persists and price holds above the range, buyers are still assigning value to the possibility. If the premium evaporates without formal news, the market may be paying less for the rumor.
An unsigned offer is not a cashier’s check. In a rumor trade, the largest number on the screen may be the probability you forgot to price. Catalyst creates the move. Confirmation gives permission.™
02CBRS — CEREBRAS
Quarterly results, outlook increase and Microsoft relationship · +19.39% reported premarket observation
CBRS — CEREBRAS

Cerebras walked into the session with the kind of earnings response that makes AI investors forget their coffee—and almost forget valuation.
WHAT?
Cerebras advanced on its latest quarterly results and an improved outlook. An earlier premarket reading showed a 19.39% gain; another published snapshot showed a smaller rise. That variation is a reminder that premarket percentages are moments in time, not permanent facts. The core catalyst is the company’s forward business expectations, not merely the existence of an earnings release.
SO WHAT?
For a fast-growing AI hardware company, the market is buying expected future shipments, revenue conversion and gross profit. Raising the outlook can increase the earnings base investors model, but it can also increase the expectations the company must beat next quarter. The transferable lesson is guidance elasticity: the bigger the premium attached to future growth, the larger the price response when management changes the expected growth path. Revenue quality and cost to serve still matter.
NOW WHAT?
Compare the opening range with the premarket high, and look for follow-through in AI hardware peers rather than relying on one isolated ticker. Strong volume that supports a higher price after the open would favor continued repricing. A sharp reversal despite an upbeat forecast suggests the price already assumed more progress than the release delivered.
The market does not pay a premium for the word “AI.” It pays for the part of AI that eventually shows up in margins and cash flow. Catalyst creates the move. Confirmation gives permission.™
03NVDA — NVIDIA
Rebound following Jensen Huang departure · +2.6% reported premarket observation
NVDA — NVIDIA

Nvidia proves why a founder can become part of the valuation model. The company may sell silicon, but Wall Street also prices confidence in the person steering the factory.
WHAT?
Nvidia was reported modestly higher in an early Friday premarket observation after the prior leadership shock involving Jensen Huang. The reported reading in the working manifest was +2.6%. A rebound is a price observation; it does not, by itself, settle the company’s leadership questions or confirm that the prior risk premium has fully returned.
SO WHAT?
When a founder shapes product timing, customer relationships and capital allocation, investors can attach a leadership premium to expected earnings. A sudden transition may raise the discount rate investors apply to those same earnings without instantly changing orders for GPUs. A rebound can follow when traders believe the first decline went too far. The micro-lesson is to separate business cash flows from the multiple paid for those cash flows: they can change on different days and for different reasons.
NOW WHAT?
Watch whether Nvidia holds its opening range and whether chip peers confirm the recovery. Relative volume and a sustained reclaim of the premarket high offer more information than the first green print. If Nvidia rallies while the wider semiconductor group weakens, the market may be unwinding a company-specific oversold position rather than declaring an industry recovery.
A green candle cannot appoint a permanent CEO. Confidence returns when the tape and the operating story start telling the same story. Catalyst creates the move. Confirmation gives permission.™
04NU — NU HOLDINGS
Quarterly earnings and revenue mix · +3.51% reported premarket observation
NU — NU HOLDINGS

Nu Holdings is where the growth story meets the credit committee. In digital banking, adding customers is exciting; keeping their economics healthy is the actual business.
WHAT?
Nu Holdings entered the premarket conversation following quarterly results, with a reported early gain of 3.51%. Investors are weighing operating momentum against the quality of credit growth and the economics of serving a larger customer base. The percentage describes an observed quote, not a synchronized 8:45 AM ET settlement.
SO WHAT?
A bank or fintech can grow revenue by attracting deposits, lending more, and expanding services. But credit costs and funding expenses decide how much growth reaches the bottom line. Strong loan growth funded by deteriorating underwriting can increase reported revenue while damaging future earnings. The transferable lesson is earnings mix: in financials, look below customer acquisition and headline revenue to net interest margins, delinquencies, and loss provisions. The market eventually separates profitable scale from expensive scale.
NOW WHAT?
Compare Nu’s first trading range against financial and fintech peers. An advance supported by unusual volume and steady peer participation reinforces the view that investors like the quality of the quarter. A fading move despite an apparently good headline may point to concerns embedded deeper in the earnings mix or the forward outlook.
A million new customers make a beautiful slide. A million profitable relationships make a business. Catalyst creates the move. Confirmation gives permission.™
05MSFT — MICROSOFT
Microsoft 365 outage disrupts enterprise users · −2.1% reported premarket observation
MSFT — MICROSOFT

Microsoft can sell businesses a subscription to productivity. When the subscription stops being productive, the market starts rewriting the renewal conversation.
WHAT?
Microsoft faced an enterprise-service reliability story after a Microsoft 365 outage. An early premarket observation had shares down 2.1%. A service disruption is an operational event, but the immediate revenue consequences, duration and contractual exposure should not be assumed from a single report.
SO WHAT?
Enterprise software valuation depends on durable recurring revenue, renewal rates, and customer trust. If outages become frequent or severe, clients may demand service credits, extra redundancy or alternatives; each can affect margins or future net retention. One incident does not establish a permanent deterioration. The lesson is reliability economics: a subscription business earns its premium not only by signing contracts but by making itself indispensable without becoming a source of business risk.
NOW WHAT?
Track official service-restoration updates and whether Microsoft recovers the opening range after customers regain functionality. Compare its price action with other megacap software companies. If the stock remains weak while peers stabilize, investors may be pricing a company-specific operational issue. If the whole group drops together, inflation and valuation may matter more than the outage.
Recurring revenue is lovely. Recurring reliability is what keeps the revenue recurring. Catalyst creates the move. Confirmation gives permission.™
06AMD — ADVANCED MICRO DEVICES
AI-chip rotation after prior Nvidia weakness · −1.60% reported premarket observation
AMD — ADVANCED MICRO DEVICES

AMD is competing for the next AI dollar while the market is renegotiating what a future dollar is worth. That is a two-front battle even for a strong chip company.
WHAT?
AMD was reported down roughly 1.60% in an early premarket observation amid unsettled AI-chip sentiment. The price move alone does not prove a new company-specific demand deterioration. The relevant setup is how investors weigh chip competition, future sales expectations, and the higher discount rate implied by stubborn underlying inflation.
SO WHAT?
Semiconductor valuations combine expected unit demand, pricing, supply constraints, manufacturing costs and investor willingness to pay for distant earnings. When rates rise, high-growth cash flows can be discounted more heavily; when a competitor experiences a shock, customers might diversify—but the competitive outcome is not automatic. The transferable lesson is sector sympathy versus competitive substitution. Two chip stocks can react differently to the same headline because one owns the demand today and another may be perceived to gain share tomorrow.
NOW WHAT?
Compare AMD with Nvidia, Broadcom and the broader semiconductor index in the first 30–60 minutes. If AMD weakness is accompanied by broad chip selling and rising yields, the market is likely repricing the group. If peers strengthen while AMD continues lower, investigate company-specific expectations before treating the move as simple sector rotation.
A rival’s headache is not automatically your earnings upgrade. Customers still have to place the order. Catalyst creates the move. Confirmation gives permission.™
07AVGO — BROADCOM
Sympathy retracement in AI infrastructure shares · −1.51% reported premarket observation
AVGO — BROADCOM

Broadcom is the less glamorous side of the AI gold rush: custom silicon, infrastructure plumbing and a very real question about how much of the spending wave becomes profit.
WHAT?
Broadcom had a reported early premarket decline of about 1.51%. The working report connects the move to pressure across AI infrastructure names, but a shared decline should not be presented as proof of a new Broadcom earnings warning. This is a sector-read observation unless issuer news supplies a more specific cause.
SO WHAT?
Broadcom’s valuation can respond to expected demand for networking and custom chips, customer concentration and the margin mix of infrastructure software versus hardware. An AI buildout could generate sales across multiple layers while investors disagree on which layer captures the best return. The micro-lesson is value-chain economics: the company enabling a trend is not always priced the same as the company selling the final product. Mix, customer bargaining power and capital intensity decide the profits.
NOW WHAT?
Watch AVGO against chip peers and the Nasdaq futures. A recovery with improving sector breadth favors a common factor unwind; persistent relative weakness invites attention to customer and margin assumptions. Monitor the opening range and relative volume instead of assigning an elaborate narrative to a small, time-specific premarket change.
Everyone wants to own the gold rush. The smarter question is which supplier keeps the margin after the digging starts. Catalyst creates the move. Confirmation gives permission.™
08IMVT — IMMUNOVANT
Biotech premarket weakness · −8.7% reported premarket observation
IMVT — IMMUNOVANT

In biotechnology, a single development can change the odds of a future product. The painful part is that the stock can change its mind before the clinical picture does.
WHAT?
Immunovant appeared among premarket decliners with a reported drop of 8.7%. The earlier working report did not independently establish a company-owned Friday announcement explaining the decline. That makes the observable price move the starting point—not permission to invent a clinical, regulatory or financing catalyst.
SO WHAT?
A clinical-stage biotechnology company is valued through probabilities: likelihood of trial success, regulatory approval, market size, timing, and how much capital must be raised before commercialization. Small revisions to those probabilities can produce large changes in estimated value. The lesson is binary-risk pricing: a sharp share move is not itself evidence that a trial failed. Without identifying the catalyst, the analyst’s first job is to preserve uncertainty and avoid converting market action into fabricated medical facts.
NOW WHAT?
Look for an issuer release, SEC filing or clinical-trial update to explain the tape. Then compare relative volume and the opening range with biotechnology peers. A continued decline alongside a clear company filing deserves a different interpretation from a high-volatility move without new disclosed information.
A red chart is not a clinical study. Learn what changed before you decide what it means. Catalyst creates the move. Confirmation gives permission.™
09BRZE — BRAZE
Software premarket selling · −6.4% reported premarket observation
BRZE — BRAZE

Software companies sell recurring revenue. Their shareholders, meanwhile, are often paying in advance for several years of perfection.
WHAT?
Braze was cited among Friday premarket decliners, with an early observation of roughly −6.4%. The available working sources did not establish a fresh issuer catalyst for this exact quote. It is therefore more accurate to frame the move as price pressure to investigate rather than declaring a confirmed guidance cut.
SO WHAT?
Subscription software stocks reflect revenue growth, gross retention, net expansion, operating margins and expected free cash flow far into the future. A stock can fall even if the company is operating normally when investors demand a lower multiple for those distant cash flows. The micro-lesson is duration risk in equities: a business whose valuation depends on earnings several years out can be unusually sensitive to rate expectations and changes in the market’s appetite for growth.
NOW WHAT?
Check whether Braze diverges from comparable application-software shares and whether any company filing or credible new coverage supplies the missing explanation. Watch opening-range support and volume. Shared software weakness suggests an industry valuation factor; isolated high-volume selling merits closer issuer analysis before assigning causation.
The subscription can renew on schedule while the valuation multiple gets canceled before breakfast. Catalyst creates the move. Confirmation gives permission.™
10CSCO — CISCO
Earnings beat meets restrained response · −1.72% reported premarket observation
CSCO — CISCO

Cisco is the networking veteran in an AI market obsessed with new toys. Sometimes the wires and switches are the most important part of the machine—and still cannot escape a skeptical forecast.
WHAT?
Cisco was reported around 1.72% lower in an early premarket reading following discussion of its earnings and outlook. That is a snapshot of the market’s response, not proof that Cisco missed every reported metric. Investors may react differently to current-quarter results and the growth implied by management’s next forecast.
SO WHAT?
Networking demand depends on enterprise spending, cloud investment cycles, product mix and the timing of large orders. Even after a reported earnings beat, the stock can trade lower if the market expected faster acceleration or stronger guidance. The micro-lesson is expectation mismatch: yesterday’s consensus is not the same thing as the expectations embedded in the share price. A result can beat analysts’ numbers and still disappoint investors who paid for more.
NOW WHAT?
Compare Cisco’s first-hour action with other networking and infrastructure names. Look for stabilization above the opening range and whether relative volume supports the move. An improving price despite cautious guidance may mean the bad news was already discounted; a failure to hold support while peers strengthen points to a narrower company expectation issue.
Wall Street grades tomorrow’s exam before it finishes reading yesterday’s homework. Catalyst creates the move. Confirmation gives permission.™
THE MARKET REGIME™

Friday’s tape offers a lesson in split signals. Dow futures were quoted at 52,523.00 (+0.25%), S&P 500 futures at 7,636.75 (+0.28%), and Nasdaq-100 futures at 28,407.50 (+0.08%) in individually observed morning readings. Those modest advances were not a broad all-clear: spot VIX stood at 18.24 in an earlier observation, and the 10-year Treasury yield was reported at 5.141%. Both can change the price investors are willing to pay for growth.
Brent crude was quoted at $96.15, a further reminder that inflation-sensitive assets are not disappearing from the equation. Higher energy prices can complicate the inflation outlook, while higher yields may weigh most heavily on companies valued for cash flows many years away. Even when all three futures indexes are green, the relative strength of the Nasdaq matters: a hesitant technology index is not the same as an indiscriminate risk-on stampede.
THE MARKET REGIME™ is neither a promise of a rally nor an instruction to sell. It is a map of the variables that can validate or invalidate a premarket narrative. Watch the yield, volatility, peer participation and whether the opening range holds. The tape is the final judge.
THE MARKET READ™
A slightly softer headline inflation print was supposed to clear the runway. Instead, a hotter core figure reminded the market that the cost of capital is still demanding a seat at every earnings call. When October PPI rises 0.3% but the core advances 0.5%, investors have to distinguish one month of relief from a sustained shift in underlying price pressure.
WHAT? Friday’s company stories are not one trade. Modine is a probability-weighted deal story. Cerebras is an expectations and guidance story. Nvidia is a leadership-confidence story. Nu is an earnings-quality story. Microsoft is a reliability story. The rest of the board is a cross-examination of risk appetite, sector sympathy, and the gap between reported business results and the price investors already paid for them.
SO WHAT? Stocks can go up with hot inflation and down with good earnings. That is not a contradiction. Prices depend on the new information relative to what was already assumed, and rates decide the discount placed on expected profits. The market’s willingness to pay for growth can change faster than the growth itself. That is why a green future and a red software stock can coexist in the same opening hour.
NOW WHAT? Start with the 10-year yield at 5.141%, watch whether the Nasdaq-100 confirms the other index futures, and separate first-minute emotion from sustained opening-range behavior. Seek participation: do semiconductor peers agree with each other? Does volume back the move? Does a company’s own news justify its divergence? Make the market prove its case before risking yours.
THE F.R.E.E. ANSWER™: Follow the chain from inflation to rates, from rates to valuation, from company catalysts to forward expectations, and from expectations to price confirmation. Do not make a market call just because the headline fits comfortably on a phone screen.
THE OPERATOR RESET™
The market handed you a whole menu of stories before the bell. Takeover speculation, earnings revisions, founder uncertainty, software reliability, AI infrastructure and sticky producer inflation. Each one can change expectations, but none of them excuses abandoning a process.
Mark the premarket high and low. Draw the opening range. Compare the stock to its peers and the index. Decide what would make your read wrong before deciding what would make it profitable. You are not paid for predicting the first candle. You are paid for learning when price confirms the story.
Draw it before you trade it.™ Catalyst creates the move. Confirmation gives permission.™
EVIDENCE & SOURCES™
Release correction: the November 13, 2026 8:30 AM ET report was October PPI, not PCE. MarketWatch reported headline +0.3% MoM versus +0.4% consensus, core +0.5% versus +0.3%, and headline annual +6.5%. The BLS calendar confirms release timing. The BLS release page seen during compilation still displayed September; official October tables were not independently retrieved.
Market quote methodology: percentages shown are observations from different premarket news/market data sources, NOT a single 8:45 AM ET Google Finance synchronized capture. MOD +30.3%, IMVT −8.7%, BRZE −6.4% from an early Barron’s snapshot; CBRS +19.39% from Benzinga 4:14 AM ET; NVDA +2.6% from early AP reporting; MSFT −2.1% from WSJ; AMD −1.60% and AVGO −1.51% from an undated dynamic Investing.com table; NU +3.51% and CSCO −1.72% from secondary market reporting. Exact source timestamps not available for all quotes. No six-tile market internals values are asserted. Do not claim 8:45 quote freeze or LIVE LearnWorlds browser PASS.
- BLS release schedule
- MarketWatch post-PPI coverage
- MOD catalyst and quote source
- CBRS catalyst and quote source
- NVDA catalyst and quote source
- NU catalyst and quote source
- MSFT catalyst and quote source
- AMD catalyst and quote source
- AVGO catalyst and quote source
- IMVT catalyst and quote source
- BRZE catalyst and quote source
- CSCO catalyst and quote source
EDITORIAL SOURCE NOTES — November 13, 2026: The percentages in the ten story toggles and in the supplied graphics are observations recorded at different times, not an independently synchronized 8:45 AM ET quote set. Several issuer-catalyst explanations are qualified as interpretations because primary issuer evidence was incomplete. The market dashboard also combines five individually timed market quotes with a user-supplied 5.141% TradingView Treasury reading lacking a quote timestamp. Images are historical snapshots; figures can differ from later prices. Live LearnWorlds/browser fullscreen, zoom and host CSS isolation remain not tested.
Bureau of Labor Statistics PPI release schedule
Market Internals · Nov 13, 2026. Quotes were observed individually; timestamps are ET and are not synchronized. The 10-year figure is a user-supplied TradingView reading without a timestamp, not a Google Finance quote. Spot VIX is the CBOE spot index and may not be a live actionable pre-open price.
- DOW FUTURES: 52,523.00 (+0.25%), 9:05:40 AM ET — Google Finance
- S&P 500 FUTURES: 7,636.75 (+0.28%), 9:18:51 AM ET — Google Finance
- NASDAQ 100 FUTURES: 28,407.50 (+0.08%), 9:18:34 AM ET — Google Finance
- BRENT CRUDE FUTURES: $96.15 (+0.34%), 9:11:40 AM ET — Google Finance
- 10-YEAR TREASURY: 5.141% (change not confirmed), TIME NOT SUPPLIED — TradingView (user-supplied)
- SPOT VIX: 18.24 (+4.29%), 8:04:46 AM ET — Google Finance
TODAY’S MARKET CHAIN™
FRIDAY, NOVEMBER 13, 2026 · POST-PPI EDITION

THE MARKET READ™
Wall Street got an inflation report with two personalities. Headline producer prices rose 0.3% in October, a shade cooler than expected. But underlying prices rose 0.5%, hotter than the forecast. Annual headline PPI reached 6.5%. That's the market's Friday problem: the surface looked better while the engine kept running hot.
Futures had a modest positive bias in the available observations, but the more revealing question is whether the cost of money, borrowing confidence, trading liquidity, sector participation and price action tell the same story.
WHAT? A split inflation report landed at 8:30 AM ET.
SO WHAT? Sticky underlying costs can keep rates and valuation pressure in play, even when headline numbers look friendlier.
NOW WHAT? Follow all five links of the chain. Don't give a single headline permission to make the whole trading decision.
01RATESTHE PRICE OF MONEY›
WHAT?
The bond market has an expensive habit: it sends the bill before the stock market finishes reading the menu. October producer prices delivered precisely that tension. Headline PPI rose 0.3% for the month, a touch less than expected. Core PPI ran 0.5%, hotter than the 0.3% consensus. Annual headline inflation reached 6.5%. The 10-year Treasury yield was supplied at 5.141% from TradingView. That yield is a reference reading, not a synchronized 8:45 quote.
SO WHAT?
Long-duration businesses—the ones whose biggest profits sit years down the road—are unusually sensitive to the discount rate. As yields rise, the present value of those future cash flows can fall even when the company sells exactly as much as it promised. A strong AI story and an expensive cost of capital can be true at the same time. The lesson: read the price of money before celebrating the price of a stock.
NOW WHAT?
Compare the 10-year yield with Nasdaq-100 futures and the first thirty minutes of cash trading. If yields remain firm while growth shares struggle to hold premarket highs, valuation pressure is being confirmed. If yields ease and participation widens, that pressure may be losing its grip.
The Fed doesn't have to ring the opening bell. The bond market can do the talking. Watch the Price of Money.™
02CREDITTHE COST OF CONFIDENCE›
WHAT?
The equity market has the loudest microphone. Credit has the quieter, more useful one. The ICE BofA U.S. High Yield Option-Adjusted Spread last stood at 3.30 percentage points on November 11, versus 3.34 on November 9 and 3.42 on November 6. That is a prior-close series, not a Friday premarket print. It tells us the spread cushion investors demanded from lower-rated borrowers had recently narrowed.
SO WHAT?
A credit spread is the extra yield a borrower pays over a comparable Treasury benchmark. Rising spreads make refinancing more expensive and can force highly leveraged operators to slow hiring, spending or expansion. For capital-intensive AI infrastructure, cooling, power and cloud projects, the distinction is brutal: a compelling demand forecast is not the same thing as affordable financing. The transferable lesson is to track the cost of funding alongside projected revenue.
NOW WHAT?
Watch for a sustained widening in high-yield spreads and weakness in leveraged issuers as the session unfolds. Do not infer intraday credit conditions from the last available daily close. Confirmation would require newer spread or live credit-market evidence.
An income statement makes the promise. The cost of capital decides how much of it survives.
03LIQUIDITYTHE FUEL FOR RISK›
WHAT?
At 8:30 a.m. Eastern, the inflation report gave algorithms, hedgers and humans three different excuses to move the same market. The futures observations already collected for this edition showed Dow futures at 52,523.00 (+0.25%), S&P 500 futures at 7,636.75 (+0.28%), and Nasdaq-100 futures at 28,407.50 (+0.08%). These readings were recorded at different times and should not be mistaken for one synchronized market snapshot.
SO WHAT?
A price gap is not proof of durable buying. In thin premarket trade, an order can move the quote more than the same order would during the full session. Once the opening auction absorbs institutional flows, apparent conviction gets tested against actual depth. Your micro-lesson: separate a headline-driven repricing from real capital participation. One is noise with a suit on; the other can travel.
NOW WHAT?
Check whether the first opening range holds after the initial volatility, whether traded volume expands on advances, and whether reversals occur with heavy turnover. A move supported by sustained participation tells a different story from a brief liquidity vacuum.
Liquidity doesn't care about your exciting headline. It asks one question: who's left to buy after the gap?
04BREADTHWHO IS ACTUALLY PARTICIPATING›
WHAT?
Premarket headlines showed Nvidia bouncing more than 2% after the leadership shock while AMD and Broadcom were indicated lower by roughly 2%; Microsoft also traded lower amid Microsoft 365 service disruption. That is not a sector marching in formation. It is a sector holding a noisy committee meeting without an agenda.
SO WHAT?
A cap-weighted index can look strong when a few enormous companies rise, even if many peers are losing ground. Breadth reveals whether leadership is spreading or narrowing. In semiconductor-heavy indexes, a single mega-cap can disguise weakness beneath the hood. The transferable lesson: compare price direction across related companies rather than treating an index green print as permission to assume the entire sector is healthy.
NOW WHAT?
After the opening bell, inspect semiconductor and software advance/decline participation, the percentage of Nasdaq members above their opening prices, and the equal-weight versus cap-weight reaction. If peers join the leader, the rally has company. If they diverge, position sizing and conviction deserve another look.
One superstar can win the headline. Breadth determines whether the whole team showed up.
05PRICETHE FINAL ANSWER›
WHAT?
The market's final vote is not the press release; it is the trade. One recorded Nasdaq-100 futures observation showed 28,407.50, up 0.08%, while the S&P 500 futures observation was up 0.28%. That small difference hints at caution toward technology leadership even as broad index futures pointed higher. Among the company movers, Modine and Cerebras attracted headline-driven interest while Microsoft was pressured by an outage.
SO WHAT?
Catalysts reset expectations, but sustained price needs both willingness and capacity to transact. That is why the opening range matters: it turns the story into an observable test. A stock can carry terrific news and still fall if the market priced in an even better outcome. The lesson is not to confuse a sound business story with a sound entry.
NOW WHAT?
Mark the premarket high and low, then assess where price sits relative to the first 15–30 minute range, VWAP and peer performance. Strong follow-through with confirming breadth is different from a failed breakout with rising yields. Either outcome supplies information. Neither requires guessing.
Catalyst creates the move. Confirmation gives permission.™ Draw it before you trade it.™
Watch the Price of Money.™ · Catalyst creates the move. Confirmation gives permission.™
EVIDENCE & SOURCES™
REPORT WINDOW: November 13, 2026, after the 8:30 AM ET inflation release. Market quotations below are observations taken at different times; they are not one synchronized snapshot.
PPI figures (+0.3% headline monthly, +0.5% core monthly, +6.5% annual) from contemporaneous reporting. The BLS official page accessible during this run still displayed the prior September publication; direct October statistical release text could not be confirmed from that page.
10Y Treasury 5.141% is a user-provided TradingView reading, with no quote timestamp provided. High-yield option-adjusted spread 3.30% is dated November 11, 2026, not a Friday live print. Futures previously observed: Dow 52,523.00 (+0.25%) at 9:05:40 AM ET; S&P 500 7,636.75 (+0.28%) at 9:18:51 AM ET; Nasdaq-100 28,407.50 (+0.08%) at 9:18:34 AM ET. These are prior-tool-session observations carried from the same day's Market Internals report, not re-captured in this refresh.
The VIX figure from previous reporting was 18.24 (+4.29%) at 8:04:46 AM ET, before the 8:30 release. There is no verified post-PPI spot-VIX reading available here. Breadth commentary describes premarket peer divergence rather than an exchange-wide advance/decline total. No live post-open breadth, funding liquidity or Treasury price feed was verified.
- BLS PPI calendar and releases
- October 2026 PPI reporting — MarketWatch
- ICE BofA High Yield OAS — FRED
- Premarket context — Associated Press
- Premarket movers — Barrons
- Microsoft/Nvidia/AMD — Wall Street Journal
Educational information, not individualized investment advice. The rendered SVG is a concept diagram, not a market price chart. LearnWorlds host-browser integration requires separate testing.
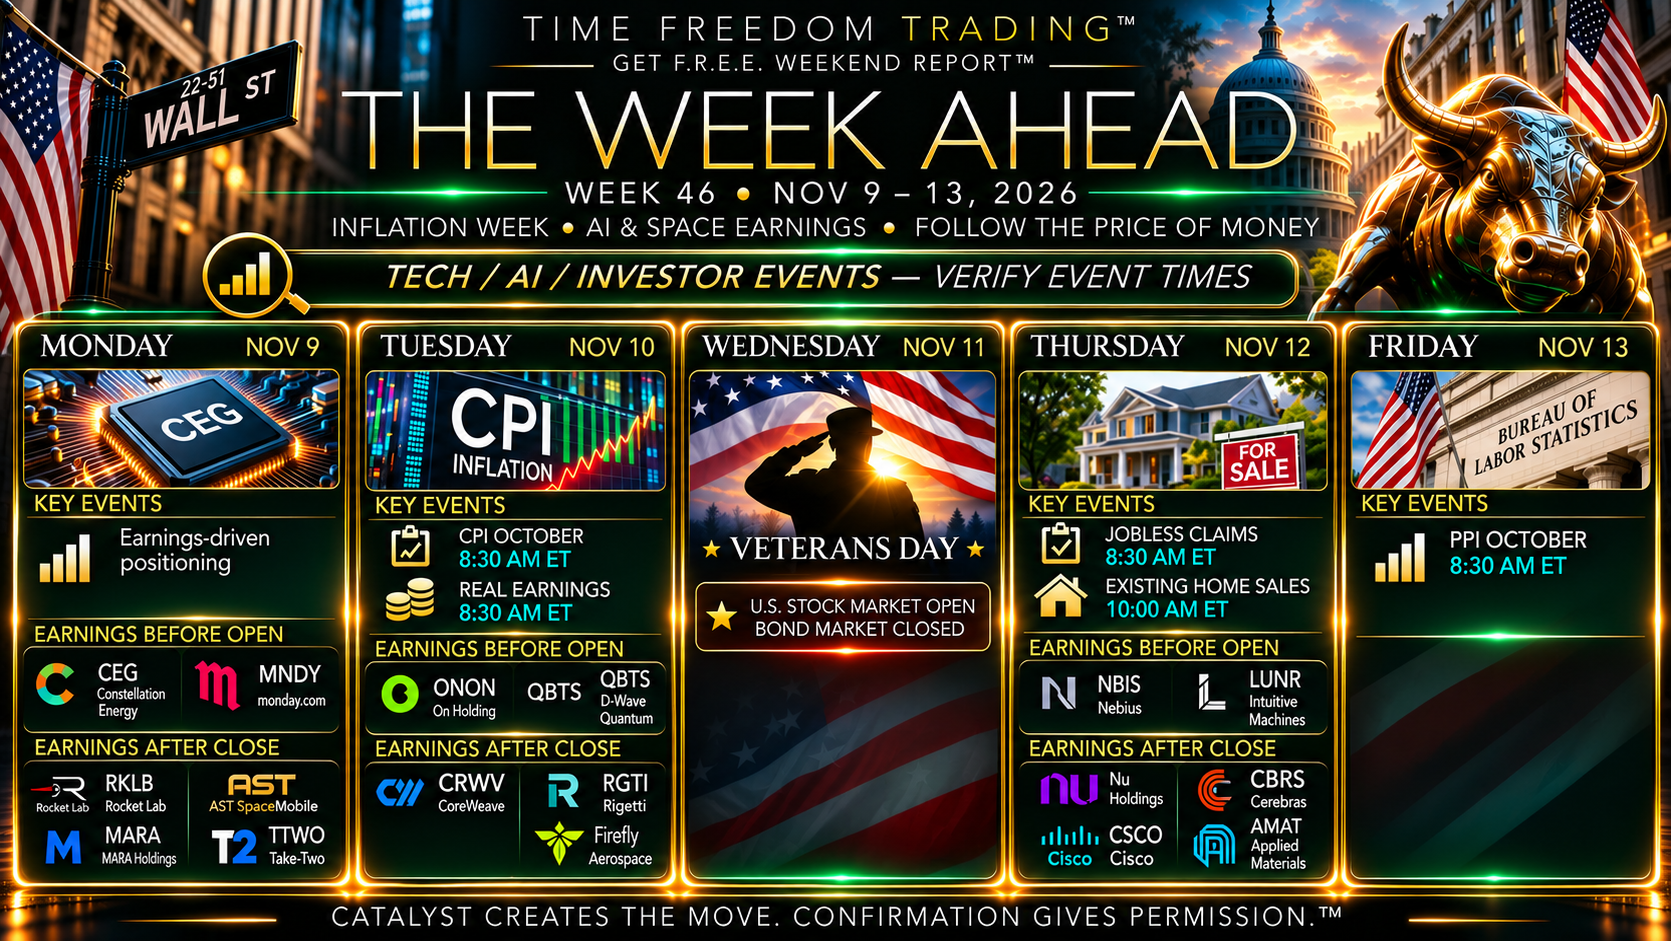
THE WEEK AHEAD™
WEEK 46 · NOVEMBER 9–13, 2026 · ALL TIMES EASTERN STANDARD TIME
THE WEEK THE PRICE OF MONEY GETS TWO VOTES™
THE WEEK THE PRICE OF MONEY GETS TWO VOTES™ — CPI Tuesday. PPI Friday. Earnings in between. After Week 45’s technology selloff, the next inflation surprise could determine whether the rebound gains traction or runs into another valuation wall.
THE WEEKLY QUESTION™: When the next catalyst hits, do Treasury yields, market breadth and price agree—or does the tape expose another headline chase?
THE WEEKLY READ™
Week 46 is a two-part examination of inflation. The Bureau of Labor Statistics schedules October CPI for Tuesday, November 10 at 8:30 a.m. ET and October PPI for Friday, November 13 at 8:30 a.m. ET. The market will not trade the headline alone; it will trade what the release does to yields, rate expectations and growth-stock valuations.
Wednesday’s Veterans Day holiday creates an unusual cross-asset calendar: U.S. stock trading may continue while bond-market and banking schedules differ. Traders should check the applicable venue’s hours and liquidity rather than assuming an ordinary midweek session.
The earnings calendar keeps AI infrastructure under the microscope. Demand is one question. Margins, capital intensity and the path to free cash flow are the questions that determine whether Wall Street rewards the next quarter or sells the next promise.
TODAY’S DATA CLOCK™ • WEEK 46
MONDAY–FRIDAY CATALYST CALENDAR™
Five trading days. Two major inflation releases. A Veterans Day cross-asset liquidity wrinkle. Several earnings tests of AI capital spending.
EARNINGS CALENDAR™
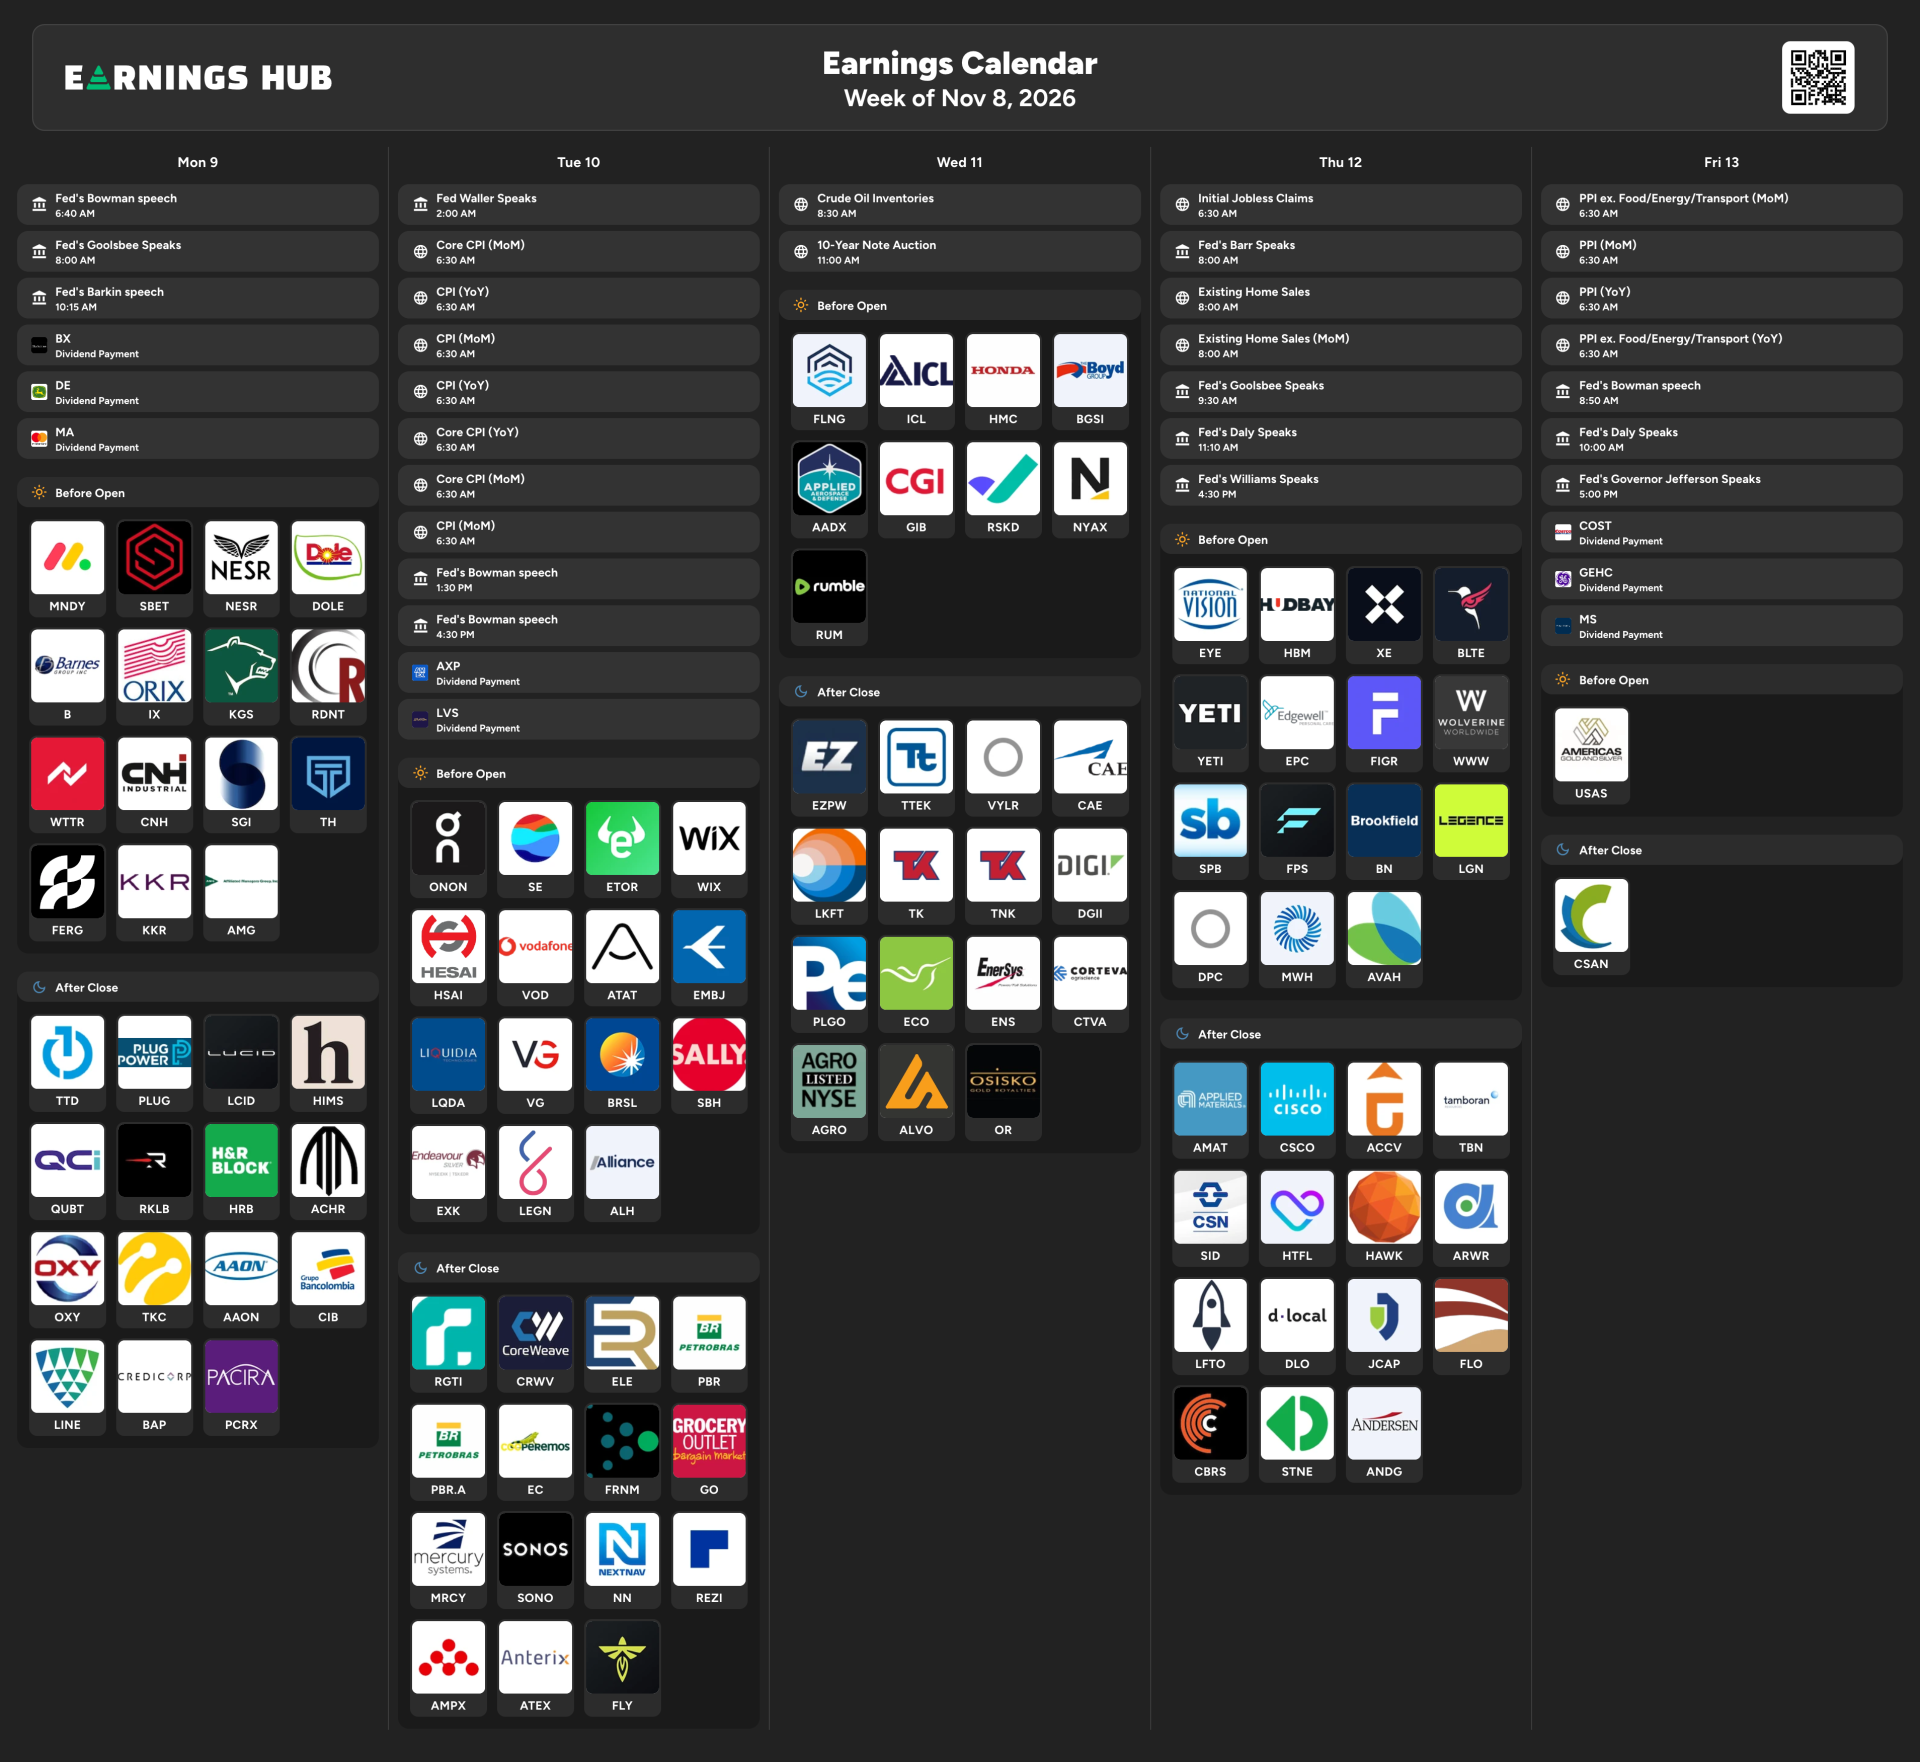
| Day | Before open / focus | After close / focus |
|---|---|---|
| Mon Nov 09 | KKR · CEG · Barrick · NRG | TTWO · RKLB · OXY · ASTS (expected) |
| Tue Nov 10 | SE · ONON · QBTS | CRWV (verify issuer session) |
| Wed Nov 11 | Veterans Day — stocks open | Company-specific reports; verify IR |
| Thu Nov 12 | Weekly claims; earnings continue | CSCO · AMAT |
| Fri Nov 13 | 8:30 AM PPI; verify issuer reports | Not highlighted |
Earnings dates and sessions are planning inputs, not guarantees. Check company investor-relations notices before trading.
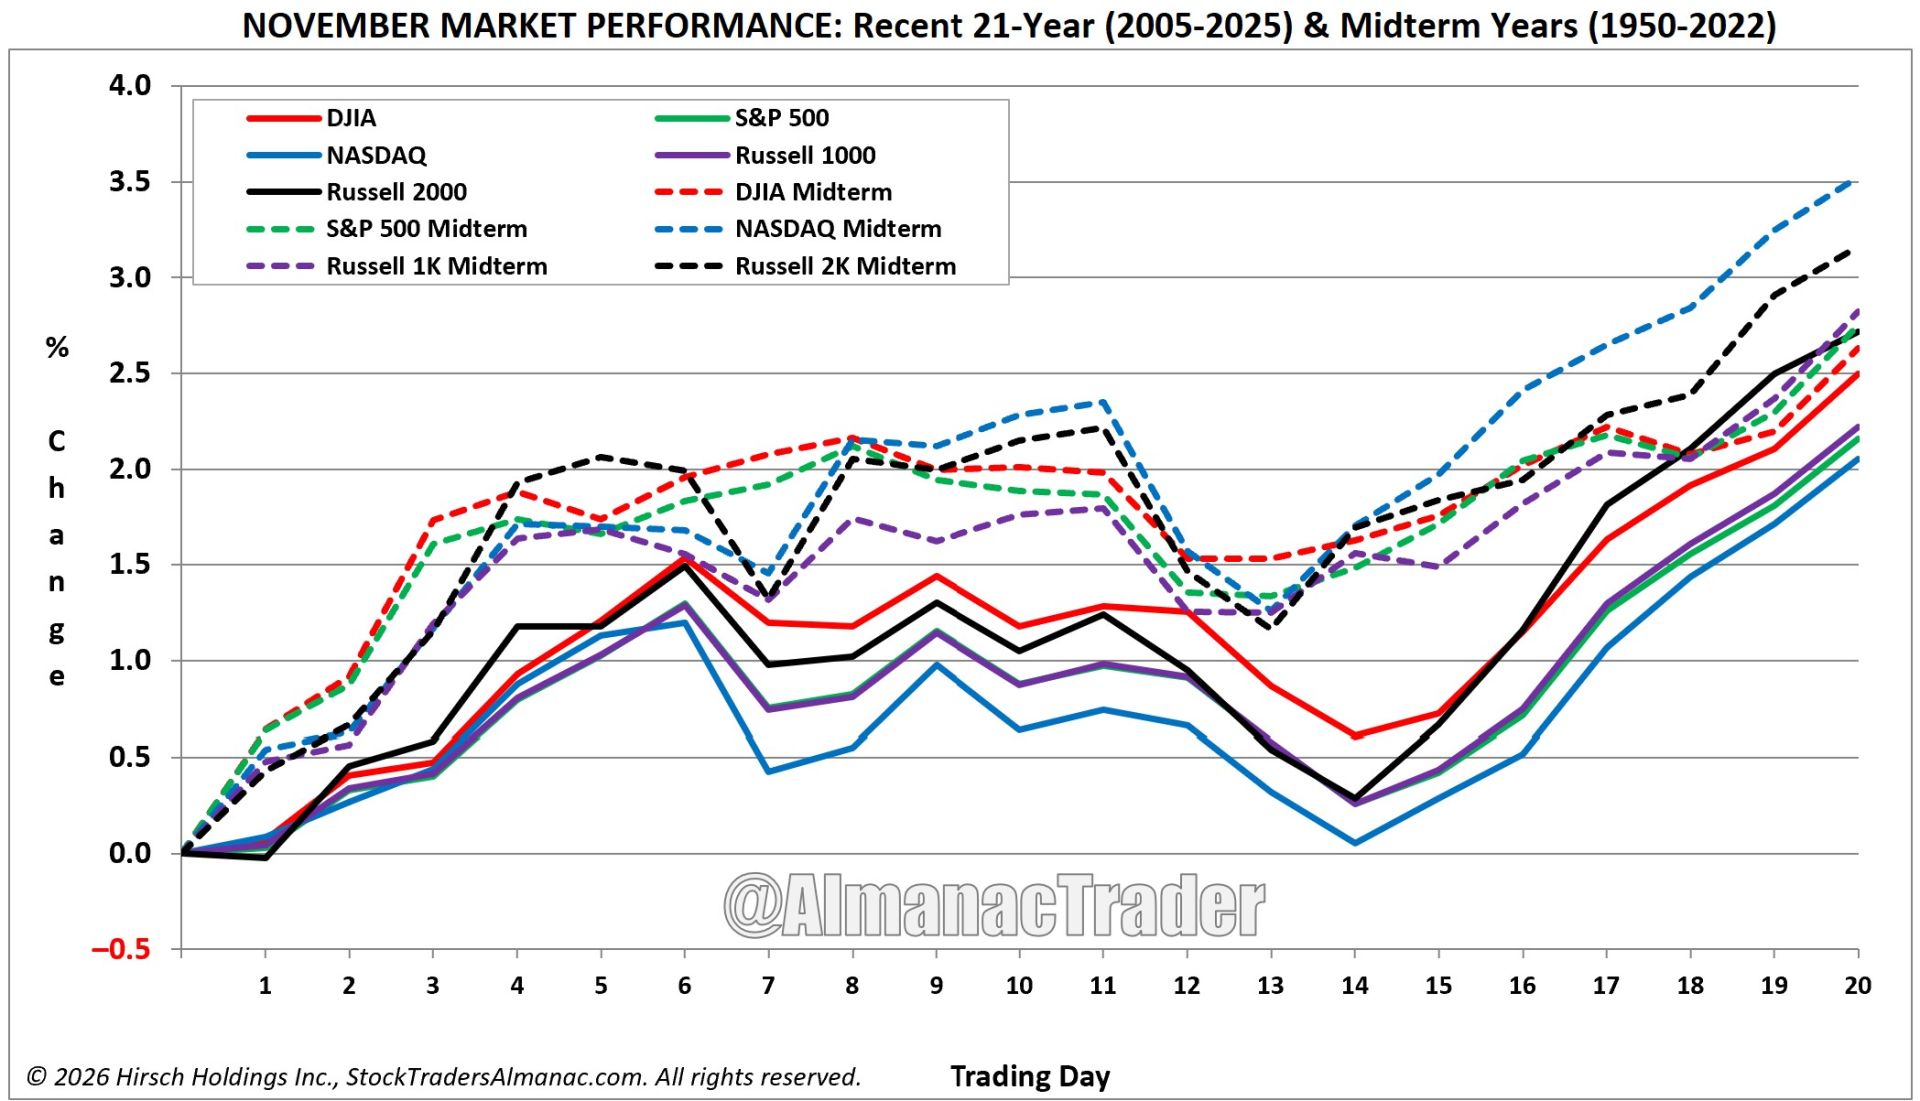
SEASONALITY™ · HISTORICAL MARKET CONTEXT
Week 46 seasonality summary is displayed alongside the earnings infographic above. Click either image to enlarge.
Historical seasonality can help frame expectations, but it is not a forecast. The six source charts below are retained strictly as historical reference graphics until Week 46-specific charts are supplied.
SEASONALITY TO CONSIDER™ · VIEW 6 REFERENCE CHARTS
THE MARKET CHAIN™
RATES → CREDIT → LIQUIDITY → BREADTH → PRICE. Tuesday CPI and Friday PPI start the rates argument; credit and liquidity reveal its reach; breadth and price decide whether the move has legs.
CATALYST RESET™
After CPI, CoreWeave, Cisco/Applied Materials and PPI, recheck yields, credit, Nasdaq leadership, breadth and the opening range. If the evidence changes, reset the thesis—not your stop-loss discipline.
RESEARCH, SOURCES & RECONCILIATION™
Economic: BLS November 2026 release calendar (CPI Nov 10; PPI Nov 13). Weekly claims and existing-home-sales calendar items require event-day reconfirmation.
Earnings: StockTitan week of Nov 9 earnings preview; ATLAS Week 46. Verify individual company IR releases and webcast times.
Market schedule: Veterans Day Nov 11: U.S. equity markets open; bond markets closed. Reconfirm any special trading or settlement requirements with exchange and market calendars.
Company-owned radar: Investor days, developer conferences and Fed appearances were not assigned fabricated times. Confirm with the official organizer before adding a named item.
Image integrity: Week 45 event and earnings banners are not represented as Week 46 artwork. Six historical seasonality charts remain labeled as references only.
KNOW THE CATALYST BEFORE THE CANDLE.™
Get This Weeks
Key Earnings / Stock To Watch
in Tradingview



LETS FIX THAT!
WANT TO LEARN MORE?

“FAST FORWARD to DECEMBER of 2026"
IS TIME FREEDOM TRADING TAX DEDUCTIBLE?

Want to
"SEE"
the Market
Correctly?

LIVE LIKE
A SUPER HERO!
A SUPER HERO!



JOIN THE TIME FREEDOM TRADING COACHING COHORT

10 TIME FREEDOM TRADING TACTICS YOU WILL LEARN!
WHAT'S INSIDE




The GET F.R.E.E. REPORT
When your ready;
There are five (5) ways I can help.

1.0 Subscribe to
The GET F.R.E.E. Report

2.0 Subscribe to
TIME FREEDOM TRADING TACTICS
3.0 The Time Freedom Trading
ON DEMAND COURSES
4.0 The Time Freedom Trading COACHING COHORT
5.0 The FREEDOM FRIENDS & FAMILY AFFILIATE PROGRAM





Register for the
FREEDOM FRIENDS & FAMILY
AFFILIATE PROGRAM!

GET F.R.E.E>

26 DECISIONS THAT WILL DECIDE YOUR 2026

#45 STOP PAYING IGNORANCE TAX

NEW YEAR: UNCERTAIN TIMES. CERTAIN EDGE.

#44 YOUR TRAINING YOUR AI REPLACEMENT.

#4 FIVE (5) REASONS EVERYONE SHOULD LEARN TO TRADE THE STOCK MARKET

# 38 FIVE YEARS FROM NOW, YOU'LL ARRIVE SOMEWHERE!

#40 Feeling FOMO for Missing the NVIDIA AI Bubble?
Share this Article on:
Learn to Earn Time Freedom;
FREE TO LIVE YOUR LIFE YOUR WAY!

Join us today
Join us today
Join us today
THANK YOU
Join us today
Join us today
Join us today
Learn to earn and earn time freedom with your profits in the stock market. Time Freedom Trading is helping MAIN STREET earn WALL STREET profits through real trading and investing strategies.
Forget the dogma of "set it and forget it" tactics with passive investing that keeps your advisor rich with fees and your account balance diminished with under performing portfolio strategies.
Time Freedom trading is helping MAIN STREET earn WALL STREET PROFITS. Can you afford to NOT find out? What is your old way of investing really costing you. Get started with TIME FREEDOM TRADING today!